Showing posts with label Embedded Debugging. Show all posts

Sunday, December 9, 2018

SWD Debugging the Arduino MKR-WiFi-1010 with Atmel ICE

Over the weekend I received my new Arduino MKR-WiFi-1010 (the ABX00023) that I purchased from Amazon, as seen here along with my Atmel ICE:


Warning: after writing this blog I realized that using the Atmel ICE can end up causing problems with the bootloader when later attempting to upload a sketch via the serial port! This was easily resolved (everything is easy, when you know how), but beware.

Update: I wrote this blog on Burning Bootloader from Visual Studio with Atmel Ice for the Arduino MKR WiFI 1010.

Ironically, I found this board shortly after commenting to Peter Scargil that I really didn't think anything could replace the Espressif ESP8266 (other than the ESP32) since it has been around for so long and has such a strong community and momentum. I found the 1010 shortly after seeing a tweet from MicroChip regarding the ATMega4809. (an 8-bit Arduino, 16MHz ceramic resonator, WiFi board using the ECC608 Crypto-Authentication chip for $44.90). The MKR1010 (32 bit!) was listed as "related product".  Now, I knew the MKR-1010 board had been released some time ago - but at the time I seem to think it was rather expensive and didn't think much more about it. However at $29.90 - that's just too appealing to pass up. Amazon prime to the rescue for me gizmo addiction: delivered the next day at no extra change! Thank you Prime!

It has been some time since my last blog post. I have a draft blog of some things that I learned with my new CNC, but it is rather messy at the moment, so instead this weekend I am back to debuggers and this MKR-1010 board.

One of the main points of interest with this board - is that in addition to the SAMD21 (specifically the ATSAMD21G18A) it also has an on-board ESP32 ... and the MicroChip ECC508 Crypto-Authentication chip! Although I really like the ESP8266 boards, I will say that JTAG debugging was not exactly the easiest and most robust, as noted here and here. One thing about the Atmel ICE is that in Atmel Studio, it is a fairly robust and reliable hardware debugger.

So fresh out of the gate, I was disappointed that I did not have a cable for (what I thought) was the Single Wire Debug (aka SWD) connector:

Comparing a 50 mil connector to what I thought was the SWD connector.

Note that black connector not a 0.1 pin spacing, it is already the small 50 mil connector that is on the Atmel ICE. The white connector below is even smaller than that!

I spent an embarrassingly long time scouring the internet for anything I could find on "Arduino MKR 1010 SWD Debugging Connector". I could not even determine what that tiny white connector is called so that I could order one. I even posted a plea for help on the Arduino MKRWiFi1010 forum,

Eventually, I found this post where someone was asking about connecting the Atmel ICE SWD to the MKR-ZERO. Although I had no indication the 6 pads on the underside of my MKR-1010 were actually the J2 SWD pins, I was hopeful that the folks at Arduino would have standards and consistency.

Schematic diagram for MKR-1010 SWD Connector (pads on reverse)

The Maker Zero SWD pins are as shown here, in this diagram provided by Federico_Vanzati:

MKR-Zero SWD Pins for Atmel ICE
Keep in mind I had no experience, no knowledge of the MKR-Zero, however the MKR WiFi 101 is just a bit similar, once you see them both, eh?
MKR-1010 board from the Arduino site
So although I was confident and hopeful that I could finally get the Atmel ICE to connect, I was still stuck with 6 pads and no holes. I really wish the Arduino folks would have made a more debug-friendly connector.

Fortunately, I had some of those snap-apart headers on hand. I bent two sets of 3 pins...


Header with some pins bent for the surface-mount SWD pads.

...and stuck them both into a 6-pin cable connector to hold them in the proper position for soldering:

Preparing the home-made surface mount headers in a 6 pin connector.

Be sure that the longer header pin is not pulled through when bending them: Not only do you want to have a good length for electrical contact, but you also don't want them too long on the PCB. Yes, there's a solder mask layer that should act as an insulator, but I would not count on it.  Make sure that pins are only as long as the solder pads. I needed to trim mine.

Note that using sets of three will increase overall mechanical strength - but as they are surface mounted, care should be taken when inserting & removing connections.

So the reality of annoying future breadboard use becomes quite apparent once the header is soldered in place. Clearly the designer prioritized the Arduino logo over the practicality of pad header placement:

My MKR-WiFi-1010 SWD Header Connection, freshly soldered on

I'm thinking if I plug it into a breadboard, I'll just use some of those stackable headers. Still, this will leave many more mechanical connections and many more places for connection problems.

From the MicroChip / Atmel ICE docs - these are the pins used for SWD on the SAMD21 chips:

SAMD Pins for SWD Debugging with Atmel ICE (from the User Guide)
Upon reading the pinouts and looking at the cables and adapters that I have for the Atmel ICE, I realized that my only option was to use that handy-but-annoying Squid Cable.

Arduino MKR WiFi 1010 with SWD Atmel ICE Pin Numbers shown.

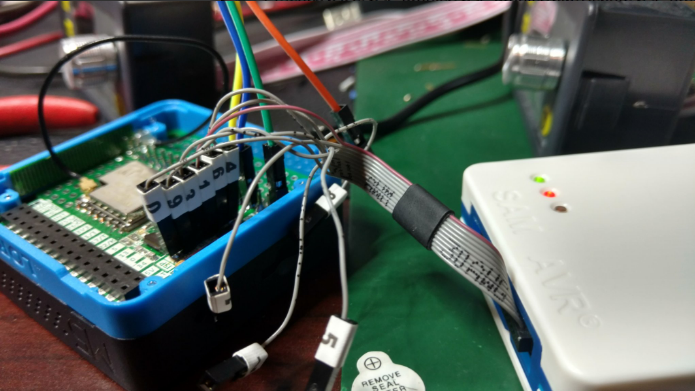
Here's what the board looks like connected to the Atmel ICE:

Arduino MKR-WiFi 1010 connected to Atmel ICE with the Squid Cable.

I sure wish a simple 10-pin header would have been installed on the MKR boards - that would connect directly to the Atmel ICE debugger. Well, no worries.. good to go!

There's a MKR-Wifi-1010 tutorial on actually using the WiFi here on GitHub. I actually used the WiFi tutorial page to get started. I took the ino file and pasted it into the Arduino IDE and compiled to ensure everything was working properly. Then I created a new Atmel Studio project from the ino.
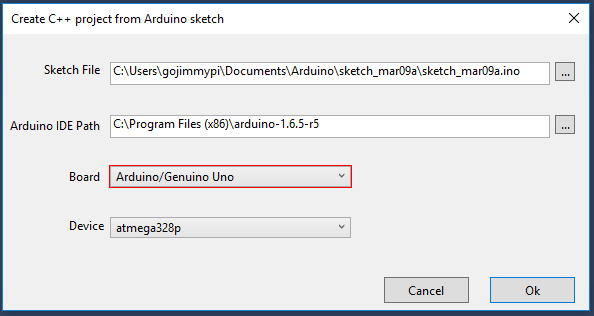
Atmel Studio setup step 1.

And on the next screen, select the location of the ino project from the Arduino IDE:

Atmel Studio setup step 2.

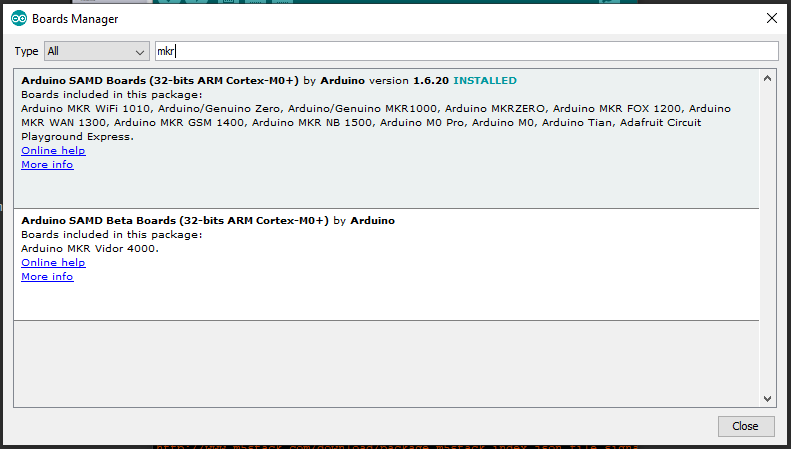
Edit Feb 2019: If you don't see the board listed, then launch the Arduino IDE and ensure it is installed via Tools - Board - Board Manager:


Type "MKR" to shorten the list:

/Edit... back  to Atmel Studio:

Connection in Atmel Studio is pretty straightforward, just select the Atmel ICE and ensure "SWD" is used:

Atmel Studio SWD Debugger Settings for Atmel ICE
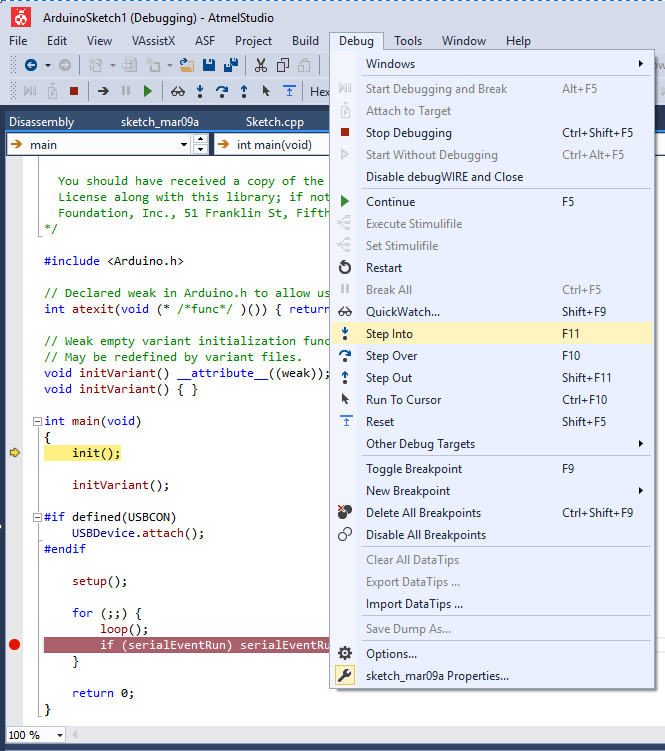
After that... voila! Click the Debug menu and step in, set breakpoints, and more!


One thing that is not super obvious when debugging with the Atmel ICE, is most sample code is "wait forever until serial port available" during setup. Well, the Atmel ICE is not the serial port!


  //Initialize serial and wait for port to open:
  Serial.begin(9600);
  while (!Serial) {
    ; // wait for serial port to connect. Needed for native USB port only
  }


So be sure to connect something to the serial port! The serial monitor in Atmel Studio is a bit wonky. I simply use putty.

See the Disassembly tab to view the assembly language generated from the source code:


The Processor button show interesting information:


Also cool to browse and inspect I/O registers:


This is SO much better than a zillion serial.println statements!

Well, I hope this saves you the hassle I encountered when trying to use the Atmel ICE hardware debugger with the Arduino MKR-WiFi 1010.

I've added a MKR-WiFi-1010 GitHub Repository with the source code and relevant pictures and documentation.

So ya, perhaps this Arduino will take over the Espressif chips ... but as there's an Espressif on-board this guy, perhaps that's not a fair comparison. Still - it is a quite interesting board at a somewhat reasonable price.

Resources, Inspiration, Credits, and Other Links:


Please leave comments, ideas, suggestions below (moderated, sometimes delayed) or send me a message at gmail, or find me on twitter.

Saturday, March 10, 2018

Single-Step Debugging the Uno ATMEGA328 (aka Arduino Uno) for the M5Stack LoRa

Today I revisit my old friend, the Microchip Atmel ATMEGA328P (aka Arduino Uno), although this is unlike any Arduino I've had before!

This is a continuation of my previous blog, where I am working on improving the range of LoRa on the ESP32-based M5Stack module. Many thanks to Jimmy Lai that sent me a prototype of the next version of LoRa module!


Note my LoRa board arrived with no headers soldered on. There's not really room for a typical install of the usual jumper headers due to how thin this the module is. I still used the standard header, but given the limited space, I inserted the plastic on the reverse side of the board and snipped off the pins on that side.


I soldered from above. I can't remember the last time I did this - if ever. One thing to keep in mind is to use as little solder as possible, as quickly as possible. The solder will want to wick up the post, making them ever-so-slightly thicker. Also - if there's a glob of solder at the bottom, the jumper wire won't fit all the way, and we're already a little on the short side from installing the header on the other side.

Ready to proceed with the fun stuff...

Upon close inspection of this new LoRa board, there's a tiny ATMEGA328P sitting there! (yes, the same micro-controller in the famous Arduino Uno (see typical Uno schematic).

Unlike a "regular" Arduino, there's no need to cut the trace for "Reset EN". (regular Arduinos programmed with the serial port have DTR connected to reset with a capacitor that otherwise interferes with ISP).

This Mega328 has the 28 pin, MLF form factor:


See the full ATMega328 spec sheet here. This Mega 328 LoRa board is connected like this:


As shown, the Mega328 sits between the ESP32 core and the LoRa RA-02 transceiver. So the plan is interrupt driven LoRa that the Mega328 handles, while I2C will be used to exchange data from the ESP32 core and the Mega328. So before doing anything, this sounds complex enough to need a serious debugger.

Fortunately I already had an Atmel ICE debugger and Atmel Studio 7 installed. As a reminder, here are the instructions:

First: ensure the latest version of Atmel Studio is installed via Help - Check for Updates (I am using Version 7.0.1645). It may also prompt you to update the firmware in the ICE Debugger. (1.27 in my case). See Tools - Device Programming.

The most difficult thing is figuring out the pins to connect. Unfortunately the LoRa module has the ISP connections in a line rather than the standard connection. Adding to the frustration is the fact that the DuPont pins on the octopus cable have taped-on numbers. Although it is handy having the connections labeled, the thickness of the tape makes having 6 of them in a row a very tight fit:


As a feature request, I hope the M5Stack folks consider implementing a standard SPI / ICSP connector:

In the meantime, it would probably be worthwhile to create a custom inline Dupont header using a kit such as this and this crimping tool. (this is incredibly handy to have)

The single most important thing is that: MO = MOSI = TDI (I wasted a bunch of time when I had assumed MO = MisO = TDO; which is not correct!). Also note that nTRST != nSRST.  (yes, I made that mistake, too; my original screen clip did not include the SPI column which makes this more obvious).

These are the correct connections for debugWIRE, aka SPI, aka ISP programming of the M5Stack LoRa ATMEGA328P:


Note that VTG is not suited to power a remote device. This is a power sensor to determine logic voltage levels. Devices being debugged, including this LoRa module most be self powered!

For more information on the ICE Debugger, read the fine manual.

I started with a simple Uno sketch file:


void setup() {
  // put your setup code here, to run once:
  Serial.begin(115200);
}

void loop() {
  // put your main code here, to run repeatedly:
 Serial.println("hello");
}


Then in Atmel Studio: File - New - Project:


Select "Create project from Arduino sketch", edit directories as needed, then press ok.  Next select the file location of the Arduino sketch. Be sure to select Arduino/Genuino Uno for Board:


It may take a short while to create a project.


Once the project is created, click Project - {name} Properties (Alt-F7). Select Atmel ICE Debugger and ensure Debug Wire is selected for interface:


Next - click Debug - Step Into. The first time, there will likely be a warning about fuse settings:


Press Yes to set the fuses appropriately. If you get any other errors, check the wiring. Then recheck the wiring.

If successful, there will be a message that debugWIRE is enabled. BE SURE TO READ THE MESSAGE:


Note that you MUST power cycle the Mega328 (in our case the M5Stack & LoRa). Do not power cycle the Atmel ICE debugger.

Press ok, and VOILA!


I recall reading that the ATMega328 *must* have debugging properly disabled upon completion or Really Bad Things might happen (really?). I still do this, although I've never actually tested it to be sure. While paused at a breakpoint, click Disable debugWIRE and Close.


So the next step will be seeing if I can get the RadioHead drivers working on this new LoRa module... but first I'd like to get the LoRa AVR serial port working.


Resources, Inspiration, Credits, and Other Links:


Monday, March 20, 2017

More on Segger J-Link and VisualGDB.

In my previous post, I explained the problem of J-Link JTAG drivers being changed by OpenOCD in VisualGDB, and my difficulty in putting back the proper drivers for use by Segger utilities.

Since posting this information to twitter and sysprogs forums, I've learned some interesting (and cool) things:

1) The clever folks at Sysprogs have their own "zadig-like" USB driver tool (strategically called USBDriverTool), that unlike zadig, has a "put back the original drivers" feature:


And can be downloaded (free!) here:

http://visualgdb.com/UsbDriverTool/

2) Additionally - the kind support folks at Segger responded to my email and pointed out that VisualGDB also supports talking to the Segger GDB server directly (instead of using OpenOCD). There's even an excellent example:

https://visualgdb.com/tutorials/arm/stm32/

Note in particular that instead of picking the J-Link device from the OpenOCD Debug method drop-down list, that there's a "J-Link JTAG" debug method also listed!


3) The Segger folks also have an explanation on the J-Link showing up as a BULK device in Windows. This is not a problem I had, but I am including this as relevant:

https://wiki.segger.com/J-Link_shown_as_generic_BULK_device_in_Windows

The screen snips there appear to be from an earlier version of Windows. Additionally, as noted in my proir post - simply selecting "Update Driver" would result in Windows saying that the drivers are already the current ones (even though it does not work). So you may need to delete the drivers before attempting the update when seeing this "BULK" driver issue.


Friday, March 17, 2017

JTAG Debugging for ESP32

Notes and information on JTAG Debugging the ESP32 WROOM-32 (aka DevKitC, aka ESP32_Core_Board_V2)

I started off my day thinking I'd take my ESP32 for a JTAG test drive. Searching for pinouts I quickly realized there are known bad pinouts floating around. This was quite a surprise as the ESP32 has been out for well over a year. I wasted a ton of time on that. I'm posting my findings here.

As one might expect - the Adafruit pinout appears to be the most accurate one:


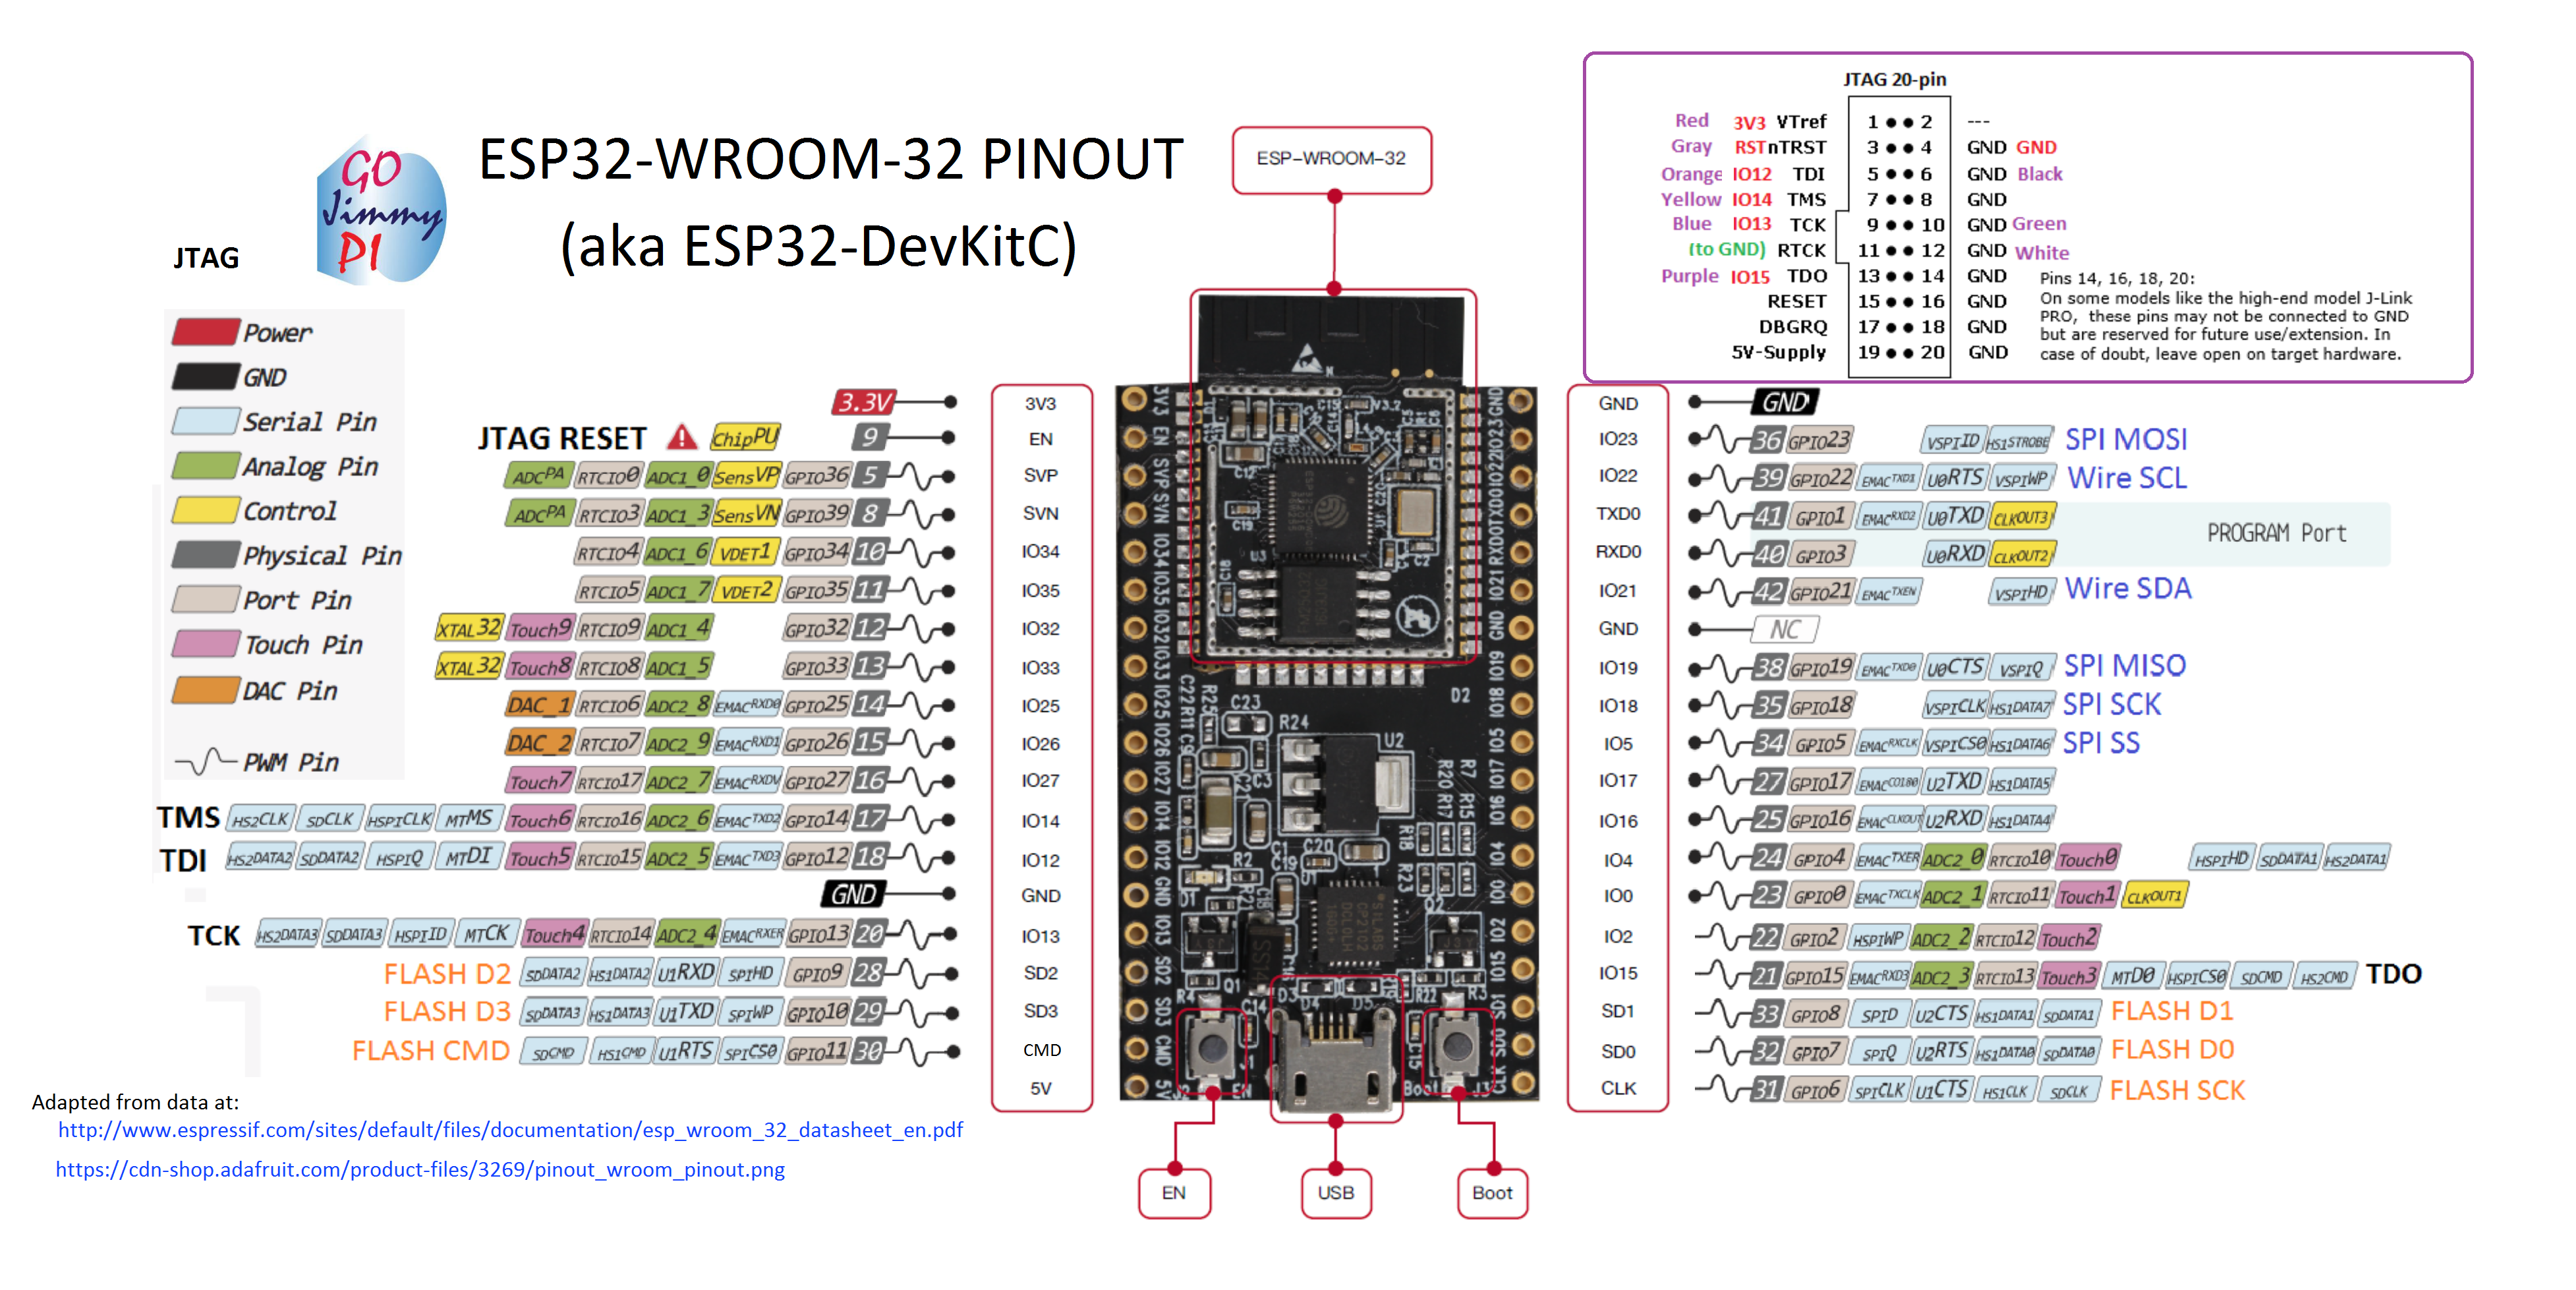
WROOM-32 ESP32 Pinout
 from: https://cdn-shop.adafruit.com/product-files/3269/pinout_wroom_pinout.png

(many thanks to the folks at @esp32net for responding to my tweet and helping to identify correct pinout).

So if you happen to see the pinout on the sparkfun site, the information is WRONG (hopefully they will correct it soon):

https://www.sparkfun.com/news/2017 (bad pinout here!)

I modified a known-good pinout image to create this little reference to easily identity a bad ESP32 pinout. Hint: look for the locations of the GND pins.


Not all online pinouts are accurate. Here's where to find proper GND on ESP32


Really, the ultimate authority is of course the Espressif data sheet:


The PDF has this pinout overview, with the functions listed in a table on the following pages of the PDF:


See also the Espressif ESP-IDF docs on GitHub:

Ok, so once the correct pinout is found - there was a moment of "oh no, all the JTAG pins are not available on my CoreBoard V2 breakout (grumble, grumble I don't want to solder them on)". But no... all good. Who would think that SD2 = TCK?

I should mention that "ESP32_Core_Board_V2" is the same as "ESP32-DevKitC"

Resources available here:

In particular the PDF of schematic found in "ESP32 Development Board Reference Design":

found in the zip buried in this directory:
ESP32_Development_Board_Reference_Design\ESP32-DevKitC(ESP32_Core_Board_V2)\01_Schematic


I took a variety of sources and copy/pasted into a new pinout diagram for myself:


This one is the whole dev board and includes the 20 pin JTAG header, and my (arbitrary) color code:

ESP32-WROOM32 Pinout for ESP32 DevKitC / ESP32_Core_Board_V2


So these days, I've been really enjoying the JTAG capabilities of the Sysprogs VisualGDB:

They have a tutorial for ESP32 JTAG here:

Online tutorials are really awesome. I wonder how long it would have taken me to figure out Step 7 on my own! ha! (issue with Visual Studio/ESP-IDF framework and optimization default problem: who would have guessed?)

But that tutorial is using the Sparkfun ESP32 Thing, and mine is the Adafruit ESP32 Core Board V2, mentioned above.

Note: Although the Sparkfun apparently has an LED on GPIO5 - according to the schematics, the only LED on this board is the power LED - so don't expect it to blink - unless you are having really serious power problems! ;) But the sample code does indeed control GPIO5.

There's a recommended max of 6mA per pin on ESP32, with and absolute max of 12mA (read: you could still damage or shorten life). Many LED's run at 20mA and drop 1.8V. At (3.3V - 1.8) =  1.5; this means you should be using at least a (1.5/0.006) = 250 or 270 ohm resister for only 6mA. This may not result in a very brightly illuminated LED.

Here are a couple of hookup pics:


JTAG connections for ESP32


JTAG connections to Segger J-Link for ESP32


For information on VSCode debugging of ESP32, see this post.


Visual Studio 2017 source code for ESP32 JTAG Tutorial:

As a bonus, the tutorial is based on freeRTOS (I think all of the ESP32 code is using that). There's a pretty good UDemy FreeRTOS class that I'm taking:

Where to buy:

https://www.adafruit.com/product/3269


See also: http://esp32.net/  (this site is so comprehensive, I should say "start here first!")

Saturday, February 11, 2017

ESP8266 JTAG Debugging in Visual Studio with Segger J-Link and Sysprogs VisualGDB

My go-to development tool so far for the ESP8266 is still the Visual Micro add-in for Visual Studio. It is however a pure software environment, that supports breakpoints, but in a different way. It is also a little odd in the way that it uses the Arduino environment - yes, in Visual Studio. But it works. Reliably. Consistently.

With my newfound confidence in getting J-Tag debugging working with the Olimex ESP8266 I decided to revisit the first unit I bought - the Segger J-Link.

Let's first start by noticing the ESP8266 is nowhere to be found on the Segger supported device list page.  But it is a standard JTAG device that when adhering to standards, Should work, no? Besides, I always enjoy a challenge.

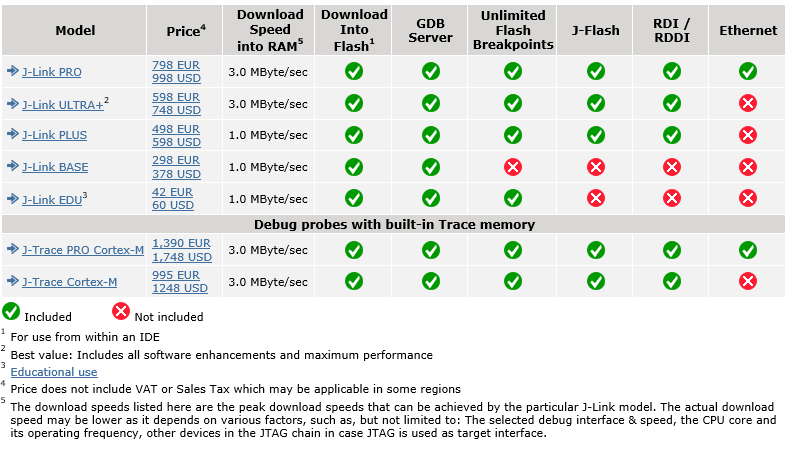
It is cool Segger has an EDU (Educational) version for only $60(USD).  A large discount over their base unit of $378, and massive discount compared to their $1000 J-Link Pro, (with of course different capabilities). Here's a screen snip from their web site comparing versions.  (or visit the Segger Model Overview page for a more detailed comparison).


I really like that the EDU version is available to any hobbyist, not just students - just provided that you are not using it to make a commercial product for profit. Segger explains more on the terms of the EDU version on their web site. One thing to note is that there's no support other than forum questions.

The Olimex ARM-USB-OCD-H/ unit is also available for about $60 from Mouser Electronics - but they do not appear to have other more advanced units with more features. The Segger with Ethernet could be a really cool device to have one day....

So yes, I'm over $120 into a couple of hardware debuggers that I intend to use with a $3 ESP8266.

I first tried connecting my Segger to a NodeMCU with no success. VisualGSB seemed happy with the JTAG interface at project setup / test time, but not when actually programming.

For an easy increment step - I'll revisit prgramminh the $9 Olimex ESP8266 EVB shown in the SysProgs VisualGDB ESP8266 Tutorial, using the same pins:


The first thing that was immediately obvious, is that I like the Olimex having its own 5V power supply for their EDP8266 EVB board. The Segger does not have a power supply connector, however on page 420 of the J-Link manual - "Pin 19 of the connector can be used to supply power to the target hardware. Supply voltage is 5V, max. current is 300mA. The output current is monitored and protected against overload and short-circuit. Power can be controlled via the J-Link commander". I could not find the specs on the ESP8266-EVB (surely it is less than 300mA, eh?) - but I used a separate power supply for the Olimex ESP8266-EVB.

For reference: Pages 418 and 419 of the Segger manual* shows this table of JTAG pin definitions:


* (I've requested permission from Segger to include this)

As noted in my previous blog, I am following the Syslogs VisualGDB ESP8266 OpenOCD tutorial.

Success! The Segger *does* work in the same way as the Olimex ARM-USB-OCD-H to debug the ESP8266 - but my target is still the Olimex ESP8266-EVB.  I really want to get debugging working on the NodeMCU as noted in this long and winding forum topic.


Saturday, February 4, 2017

ESP8266 JTAG Debugging in Visual Studio with Olimex ARM-USB-OCD-H and Sysprogs VisualGDB

To date, my go-to development environment - in Visual Studio 2015, is the VisualMicro add-in. There's no hardware debugging, but I've found it easy to use and reliable.

However, I've been interested on getting JTAG ESP8266 hardware debugging working in Visual Studio using the Sysprogs VisualGDB add-in - with mixed results.

I started with the Altera Bus Blaster than I already had on hand for programming Arduino. (hint: don't bother, it won't work: no reset control - see this discussion )

There are several tutorials, some not really up to date, but each with interesting information:

Developing projects for the ESP8266 WiFi chip with Visual Studio - August 24, 2015
Debugging ESP8266 firmware with Olimex ARM-USB-OCD-H - September 9, 2015
Debugging ESP8266 firmware with the UART GDB Stub - October 14, 2015
Debugging ESP8266 code with OpenOCD and Visual Studio - November 5, 2015

First, just figuring out which JTAG debugging hardware to buy: first I tried the Segger (kudos to them for having a generous discount for people not developing to sell a product). The Sysprogs folks then recommended that I follow the tutorial exactly, by using an Olimex instead. Another week into my 30 day trial and Mouser Electronics to the rescue with an ARM-USB-OCD-H debugger delivered. The price was about the same as the EDU version of the Segger. (approx. $60)

I had problems even finding the ESP8266 Xtensa-LX 106 elf for GDB stub (hint, it does not display in the directory shown in tutorial!) 

I also had problems with the interesting feature to debug existing project.

In the end I did get the debugging working.

I have this video on Creating Olimex VisualGDB Embedded Project for ESP8266 :


and this video on JTAG Debugging ESP8266 with Olimex and VisualGDB


 (they are separate as Windows 10 feature "Windows Key + G" video recording does not record pop-up dialog boxes)

Here are the pinouts of the Olimex ARM-USB-OCD-H 20-pin JTAG connector and the Olimex ESP8266-EVB ESP8266 10 pin header:


Here's also a partial Olimex schematic of interest:


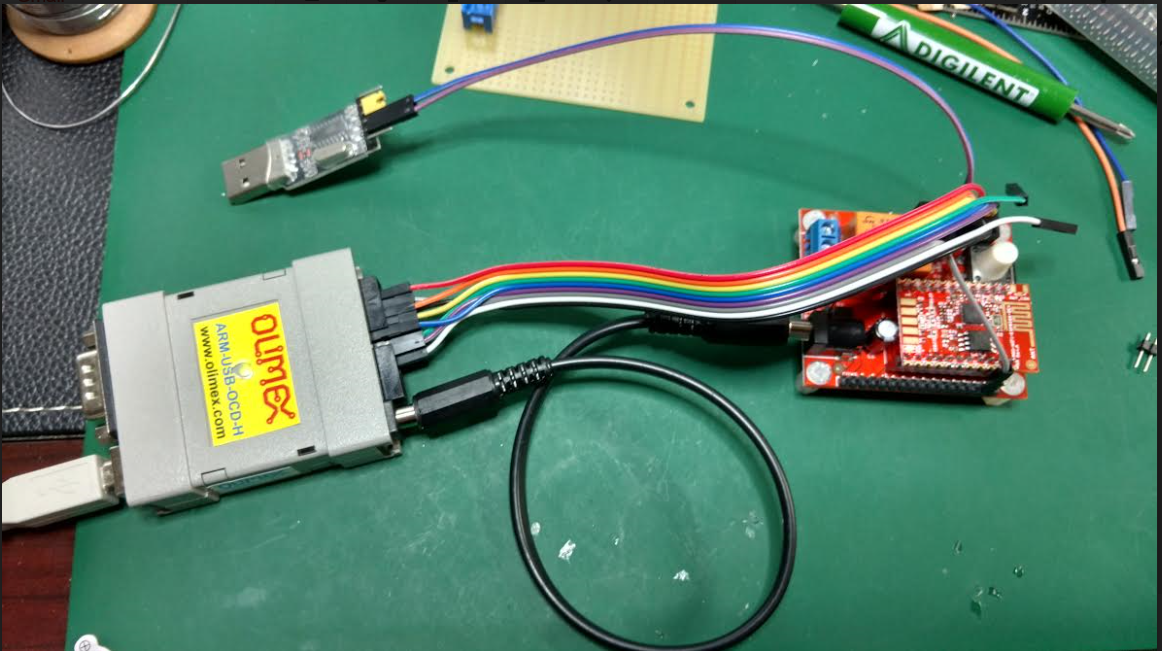
My setup looks like this:


Now that I have this working with the Olimex version of the ESP8266... on to trying to do this with the NodeMCU version!

I'll be posting updates on twitter with source code on GitHub.


Find gojimmypi at gojimmypi.github.io

I'm currently working on my new blog home at  gojimmypi.github.io After implementing a variety of features such as dark mode , syntax hi...