Thursday, May 25, 2017

VSCode JTAG Debugging of ESP32 - Part 2

This in a continuation from part 1. If you need help connecting the ESP32 to JTAG, see this post.

After setting up the ESP32 toolchain and confirming regular GDB debugging is working as described in my previous post, now it is time to configure VSCode for remote debugging of the ESP32.

I've also added Part 3 - using ESP WIP OpenOCD.

Everything is pretty straightforward here, well except for the details of actually debugging in VSCode. I had quite an ordeal with that, as described in github issue  #763: Remote Debugging of ESP32 causes EXCEPTION: System.ArgumentOutOfRangeException.

In the end, it seems that somehow VSCode was confused on the initial *state* of the ESP32 when debugging is first initiated. The first MI commands would get the ESP32 into some sort of weird state "internal to GDB":

C next: {"threadId":-2}
1: (812785) <-1022-exec-next
1: (812793) ->1022^running
1: (812793) ->*running,thread-id="all"
1: (812793) ->(gdb)
1: (812793) 1022: elapsed time 8
1: (812794) ->(gdb)
 R: {"success":true,"message":null,"request_seq":11,"command":"next","body":null,"running":false,"refs":null,"seq":0,"type":"response"}
1: (812903) ->@"esp32.cpu0: Target halted, pc=0x40080E77\n"
E output: {"category":"stdout","output":"@\"esp32.cpu0: Target halted, pc=0x40080E77\\n\"\n","data":null,"type":"output"}
@"esp32.cpu0: Target halted, pc=0x40080E77\n"
1: (812932) ->~"/home/ivan/e/crosstool-NG/.build/src/gdb-7.10/gdb/inline-frame.c:171: internal-error: inline_frame_this_id: Assertion `!frame_id_eq (*this_id, outer_frame_id)' failed.\nA problem internal to GDB has been detected,\nfurther debugging may prove unreliable.\nQuit this debugging session? "
1: (812932) ->~"(y or n) [answered Y; input not from terminal]\n"
E output: {"category":"stdout","output":"/home/ivan/e/crosstool-NG/.build/src/gdb-7.10/gdb/inline-frame.c:171: internal-error: inline_frame_this_id: Assertion `!frame_id_eq (*this_id, outer_frame_id)' failed.\nA problem internal to GDB has been detected,\nfurther debugging may prove unreliable.\nQuit this debugging session? ","data":null,"type":"output"}
1: (812932) ->&"\nThis is a bug, please report it."
/home/ivan/e/crosstool-NG/.build/src/gdb-7.10/gdb/inline-frame.c:171: internal-error: inline_frame_this_id: Assertion `!frame_id_eq (*this_id, outer_frame_id)' failed.
A problem internal to GDB has been detected,
further debugging may prove unreliable.
Quit this debugging session? 

I opened an espressif issue on giuthub for this one: [TW#12876] VSCode Debugging via MI causes internal GDB error  #645. Fortunately - with the help of @pieandcakes - I was able to determine a (yes, somewhat wonky) sequence of steps to persuade VSCode to debug the ESP32!

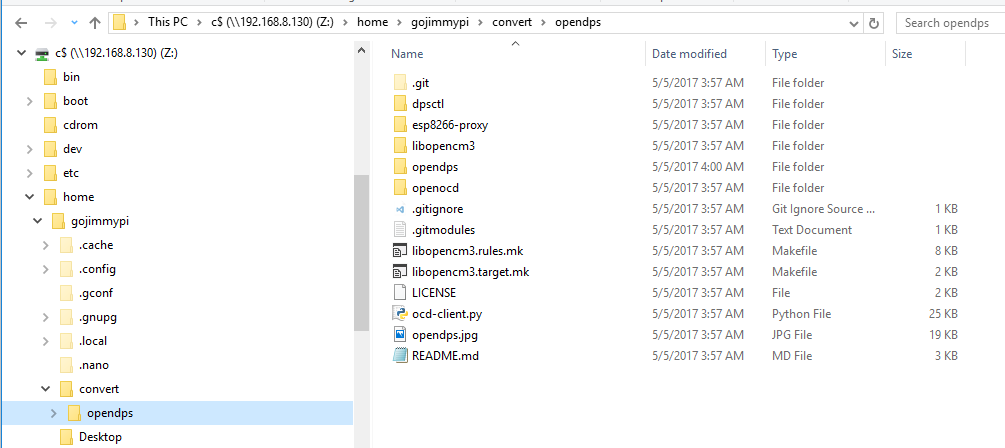
I have my openocd running on Ubuntu with samba, and have mapped my windows Z: drive to the root of the ubuntu file system. For that, my smb.conf looks like this:

## edit the file /etc/samba/smb.conf and put in these lines at the end (without single # comment markers!)
##*******************************************************************************************************
[c$]
   comment= root
   path=/
   browseable=Yes
   writeable=Yes
   only guest=no
   create mask=0777
   directory mask=0777
   public=no

## also, make sure the authentication line is not commented out
####### Authentication #######
#   security = user
##*******************************************************************************************************

# try to keep away WannaCry
[global]
min protocol = SMB2

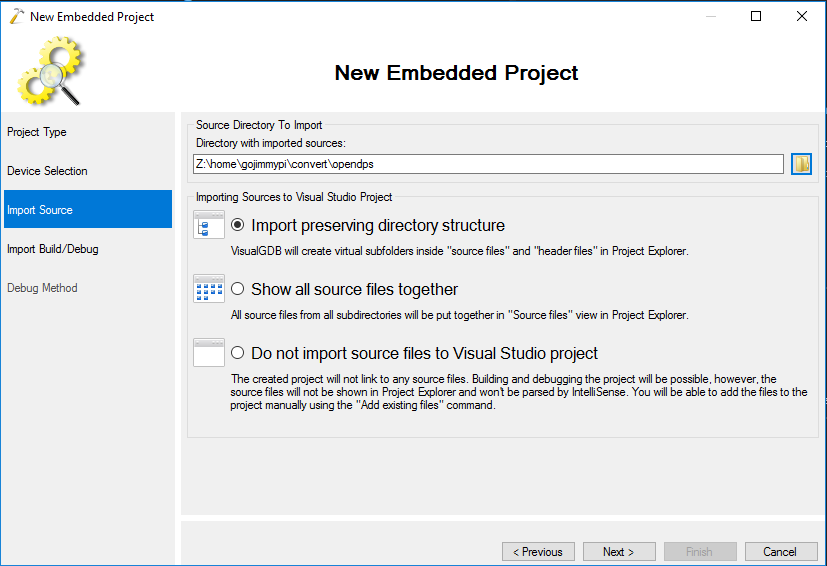
First, browse to the Hello World "Build" directory in Windows File Explorer. Right click and click "Open with Code".  The select Debug - Open Configurations. This should create a file called launch.json - in my case, in:

Z:\home\gojimmypi\esp\hello_world\build\.vscode\

Here's my launch.json for debugging the ESP32:


{
    "version": "0.2.0",
    "configurations": [
        {
            "name": "OpenOCD Debug",
            "type": "cppdbg",
            "request": "launch",
            "miDebuggerPath": "C:/msys32/opt/xtensa-esp32-elf/bin/xtensa-esp32-elf-gdb.exe",
            "program": "Z:/home/gojimmypi/esp/hello_world/build/hello-world.elf",
            "setupCommands": [
                {
                    "description": "Enable pretty-printing for gdb",
                    "text": "-enable-pretty-printing",
                    "ignoreFailures": true
                },
                {
                    "text": "file 'Z:/home/gojimmypi/esp/hello_world/build/hello-world.elf'"
                },
                {
                    "text": "target remote 192.168.174.129:3333"
                },
                {
                    "text": "monitor reset init"
                }
            ],
            "externalConsole": false,
            "cwd": "Z:/home/gojimmypi/esp/hello_world/build/",
            "logging": {
                "trace": true,
                "traceResponse": true,
                "engineLogging": true
            }
        }
    ]
}
Note that you need to choose between
"miDebuggerServerAddress": "192.168.174.129:3333"
and
"text": "target remote 192.168.174.129:3333"
- but not both! (see that first question in github issue 763). You will, of course - need to edit the IP address to point to your own OpenOCD server, otherwise you will see this error in VSCode:

Unable to start debugging. Unexpected GDB output from command "-interpreter-exec console "target remote 192.168.174.129:3333""


If you don't have a VM or a Linux box, perhaps consider a Raspberry Pi.  :)


The line

            "logging": {
                "trace": true,
                "traceResponse": true,
                "engineLogging": true

is optional, but tremendously helpful in actually seeing what's going on between VSCode and the ESP32.

I created a few gists that can either be put into script files, or copy/pasted for some basic operations. I run each of these in a separate putty shell connection. First, the compile & flash:

#!/bin/bash
export PATH=$PATH:$HOME/esp/xtensa-esp32-elf/bin
export IDF_PATH=~/esp/esp-idf

sudo chmod 777 /dev/ttyUSB0

cd ~/esp/hello_world
make flash

In this same "compile window", it can be helpful to run the serial monitor. I like keeping it in the same window as make/building, so that I am sure to stop the monitor when reflashing.

make monitor
Next, run openocd server in yet another putty connection (when successful, the openocd will not exit, rather it continues running as a server for your VSCode GDB connection as a foreground task):

#!/bin/bash
export PATH=$PATH:$HOME/esp/xtensa-esp32-elf/bin
export IDF_PATH=~/esp/esp-idf

cd  ~/workspace/openocd-esp32/tcl
sudo openocd -f interface/ftdi/olimex-arm-usb-ocd-h-1MHz.cfg -c "transport select jtag"  -f target/ESP32-RTOS-none.cfg

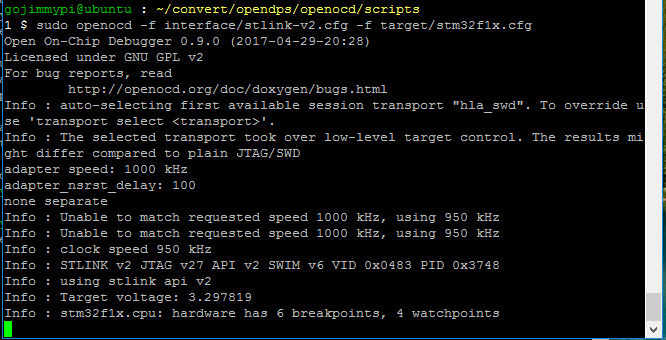
A successful launch of openocd will look something like this:

0 $ sudo openocd -f interface/ftdi/olimex-arm-usb-ocd-h-1MHz.cfg -c "transport select jtag"  -f target/ESP32-RTOS-none.cfg
[sudo] password for gojimmypi:
Open On-Chip Debugger 0.10.0-dev-g372bb59 (2017-05-19-10:35)
Licensed under GNU GPL v2
For bug reports, read
        http://openocd.org/doc/doxygen/bugs.html
adapter speed: 1000 kHz
jtag
force hard breakpoints
Info : clock speed 1000 kHz
Info : JTAG tap: esp32.cpu0 tap/device found: 0x120034e5 (mfg: 0x272 (Tensilica), part: 0x2003, ver: 0x1)
Info : JTAG tap: esp32.cpu1 tap/device found: 0x120034e5 (mfg: 0x272 (Tensilica), part: 0x2003, ver: 0x1)
Info : esp32.cpu0: Target halted, pc=0x400D1158
then the xtensa-esp32-elf-gdb debug client (the find is of course optional) this one with gdb commands in hello_world,gdb:

#!/bin/bash
export PATH=$PATH:$HOME/esp/xtensa-esp32-elf/bin
export IDF_PATH=~/esp/esp-idf
#find /. -name xtensa-esp32-elf-gdb 2>/dev/null

cd ~/esp/hello_world/build
xtensa-esp32-elf-gdb -tui -x hello_world.gdb hello-world.elf


Alternatively launch the xtensa gdb client simply like this (assume paths properly set as shown above):


xtensa-esp32-elf-gdb  hello-world.elf

A successful launch of gdb will look something like this:

gojimmypi@ubuntu : ~/esp/hello_world/build
0 $ xtensa-esp32-elf-gdb  hello-world.elf
GNU gdb (crosstool-NG crosstool-ng-1.22.0-61-gab8375a) 7.10
Copyright (C) 2015 Free Software Foundation, Inc.
License GPLv3+: GNU GPL version 3 or later &lthttp://gnu.org/licenses/gpl.html&gt
This is free software: you are free to change and redistribute it.
There is NO WARRANTY, to the extent permitted by law.  Type "show copying"
and "show warranty" for details.
This GDB was configured as "--host=x86_64-build_pc-linux-gnu --target=xtensa-esp32-elf".
Type "show configuration" for configuration details.
For bug reporting instructions, please see:
          &lthttp://www.gnu.org/software/gdb/bugs/&gt.
Find the GDB manual and other documentation resources online at:
          &lthttp://www.gnu.org/software/gdb/documentation/&gt.
For help, type "help".
Type "apropos word" to search for commands related to "word"...
Reading symbols from hello-world.elf...done.
(gdb) 

target remote localhost:3333
Remote debugging using localhost:3333
0x400d1158 in esp_vApplicationIdleHook () at /home/gojimmypi/esp/esp-idf/components/esp32/./freertos_hooks.c:52
52              asm("waiti 0");
(gdb)


We just wanted to confirm OpenOCD was working and that we could connect with linux GDB, so exit/quit.

The Windows 10 executable gdb is needed to debug in VSCode on Windows, so as shown on: http://esp-idf.readthedocs.io/en/latest/get-started/windows-setup.html it can be downloaded from here

(mine took HOURS to download)

When ready to start debugging in Windows, locate your xtensa-esp32-elf-gdb.exe, Mine is located in:

C:\msys32\opt\xtensa-esp32-elf\bin

Note the line in the VSCode launch.json:

"miDebuggerPath": "C:/msys32/opt/xtensa-esp32-elf/bin/xtensa-esp32-elf-gdb.exe",


That's the one that calls the Windows GDB client to talk to the Ubuntu OpenOCD server. This gives us the best of both worlds: assimilation! Here we can have all the reliable compile of ESP32 code in linux, yet the ability to edit and debug from Windows!

Pay attention to the forward and back-slashes in the launch.json file. See vscode-cpptools issue #706.

The details of these steps are shown in my github issue (in particular the 8th comment after the question) if you want to see more details, but in summary:

Be sure the OpenOCD server is running as described above. Press F5 to start debugging. You should see "Exception has occurred.Trace/breakpoint trap." It appears we are debugging, but we are not. Target (appears to be) running. VSCode thinks it is paused.

If you try to single step here, all bets are off; xtensa GDB crashes, VSCode debugging stops. Game over.

If instead VSCode immediately stops debugging and you see something in the debug log like:

E output: {"category":"stderr","output":"ERROR: Unable to start debugging. Failed to find thread 1 for break event\r\n","data":null,"type":"output"}
ERROR: Unable to start debugging. Failed to find thread 1 for break event
...then go back to part 1 and read about how I slightly modified my esp32.cfg

Otherwise if all is still going according to plan: type -exec continue at the VSCode > prompt.


Observe debug output. Note that despite -exec continue we are now actually in halt state. One of the lines should say:

(16086) ->@"esp32.cpu0: Target halted, pc=0x400F4AB3\n"

Press the VSCode Play button (F5). Observe error:


ERROR: Cannot execute this command while the selected thread is running.


Only after the above steps are completed, now press the pause button. Observe output. There should be no errors.

Press a code-stepping button, such as Shift-F11.... tada! Single step debugging!


For an even better experience - see FHFS comment on espressif/esp-idf issue 303,
"if esp-idf is in the project folder symbols get found automatically. for windows you can also add the msys2, mingw32 and xtensa-esp32-elf bin folders to the path in tasks.json. make monitor has some trouble starting a console, you can edit the idf_monitor.py to output to stderr(task output window), or make a .cmd file with the python command in it and run that command from tasks.
You can see how I work with it esp-idf-VSCode-template"


I'm still working on polishing these instructions. Hopefully you've found this useful. Feedback is welcome and appreciated. Send me a message on twitter, github pull request  or gmail.


Various tips:


GDB tip: Ctrl-x Ctrl-a in gdb to enter TUI mode.

You can press the EN button on the ESP32; it acts like reset and resolves many problems without having to power cycle (which will likely also need permissions re-applied,etc)

Note that as of May 2017, there's an issue in VSCode regarding the direction and quantity of path slashes as note in gitbub vscode-cpptools issue #706.

When unplugging usb devices such as your debugger and the ESP32 itself, be sure to note the order when re-inserting. Sometimes there's an unexpected recognition delay on the VM; you'll want to be consistent (e.g. having ESP32 on /dev/ttyUSB0). Trust me, you'll wait all day long trying to flash ESP32 firmware onto your JTAG debugger if it somehow ends up as /dev/ttyUSB0

If you see something like this there's a good change the JTAG adapter ended up on the default ttyUSB0 port. Edit the config or change the plug order.
>
gojimmypi@ubuntu : ~/esp/hello_world
0 $ sudo chmod 777 /dev/ttyUSB0
[sudo] password for gojimmypi:
gojimmypi@ubuntu : ~/esp/hello_world
0 $ make flash
Flashing binaries to serial port /dev/ttyUSB0 (app at offset 0x10000)...
esptool.py v2.0-beta3
Connecting........_____....._____....._____....._____....._____....._____....._____....._____....._____....._____

A fatal error occurred: Failed to connect to ESP32: Timed out waiting for packet header
/home/gojimmypi/esp/esp-idf/components/esptool_py/Makefile.projbuild:52: recipe for target 'flash' failed
make: *** [flash] Error 2


Debugging the ESP32 can be rather finicky; I spent a ton of time on the thread problem https://github.com/espressif/openocd-esp32/issues/10

If you don't see the debug console in VSCode: see View - Debug Console (Ctryl-Shift-Y)

Somehow over the course of time, my old friend "ifconfig" fell out of vogue, It is now simply "ip a". I don't really like it; harder to read. So you may need to install net-tools if ifconfig does nto work for you to determine ip addy.

Don't leave OpenOCD / GDB running when recompiling.

Don't leave OpenOCD running when disconnecting JTAG or ESP32. When the process gets stuck, closing the putty window does NOT terminate the process. Regular kill does not work. You'll need -SIGKILL


gojimmypi@ubuntu : ~/esp
1 $ ps aux | grep openocd
root      25099  0.0  0.3  54796  3964 pts/8    S+   10:30   0:00 sudo ../src/openocd -f interface/ftdi/olimex-arm-usb-ocd-h.cfg -f target/esp32-single-thread.cfg
root      25100  0.5  0.4  28660  4252 pts/8    Sl+  10:30   0:16 ../src/openocd -f interface/ftdi/olimex-arm-usb-ocd-h.cfg -f target/esp32-single-thread.cfg
gojimmy+  25176  0.0  0.0  14224   936 pts/9    S+   11:23   0:00 grep --color=auto openocd
gojimmypi@ubuntu : ~/esp
0 $ sudo kill -SIGKILL 25100
[sudo] password for gojimmypi:
gojimmypi@ubuntu : ~/esp
0 $ ps aux | grep openocd
gojimmy+  25180  0.0  0.0  14224   984 pts/9    S+   11:24   0:00 grep --color=auto openocd
gojimmypi@ubuntu : ~/esp


Resources, Inspiration, and Other Links: 


Completely unrelated, but cool:


VSCode JTAG Debugging of ESP32 - Part 1

(last edited June 2, 2017 - added WSL/Ubuntu info, but not working: JTAG device not recognized in WSL "Error: libusb_init() failed with LIBUSB_ERROR_OTHER"). I opened Bash On Windows github issue #2185 for this.

These instructions are only for Ubuntu in stand-alone (or VM) machine; not (yet) for WSL/Ubuntu on Windows.

To debug in VSCode, I am using the C/C++ for VSCode Extension along with an Olimex ARM-USB-OCD-H JTAG debugger. There are 2 main parts: installing (covered here) and debug setup (covered in part 2). I also show the wiring connections here.

If you already have the toolchain installed and want to simply debug, see step 2!

I've also added a step 3 using ESP WIP OpenOCD.

In order to get VSCode debugging the ESP32, it is probably a good idea to first get regular gdb debugging working. Although I'd like to do this fully in Windows, I start with an Ubuntu VM and use PuTTY SSH and Telnet Client to connect. (see tip below on CR vs CRLF in VSCode)

I started with the esp-idf instructions http://esp-idf.readthedocs.io/en/latest/get-started/linux-setup.html with release 2.1 from https://github.com/espressif/esp-idf. Once the toolchain is installed, there's also a special version of OpenOCD here: https://github.com/espressif/openocd-esp32


Nothing new here not presented in espressif instructions; so in brief... basically for the esp-idf:

# see https://github.com/espressif/esp-idf.git

sudo apt-get install git wget make libncurses-dev flex bison gperf python python-serial

# download the toolchain, in this case the 64-bit linux version 1.22.0-61-gab8375a-5.2.0
mkdir -p ~/Downloads
cd ~/Downloads/
wget https://dl.espressif.com/dl/xtensa-esp32-elf-linux64-1.22.0-61-gab8375a-5.2.0.tar.gz

# put the download into the ~/esp/xtensa-esp32-elf/ directory
mkdir -p ~/esp
cd ~/esp
tar -xzf ~/Downloads/xtensa-esp32-elf-linux64-1.22.0-61-gab8375a-5.2.0.tar.gz

# get the esp-idf from github, don't forget the --recursive !!
mkdir -p ~/esp
cd ~/esp
git clone --recursive https://github.com/espressif/esp-idf.git


export PATH=$PATH:$HOME/esp/xtensa-esp32-elf/bin

if installing on WSL (Ubuntu on Windows), I needed to also install:

sudo apt-get install libtool
sudo apt-get install autotools-dev  
sudo apt-get install automake # needed for aclocal
sudo apt-get install pkg-config # needed to solve error: configure.ac:12: error: possibly undefined macro: AC_MSG_WARN
sudo apt-get install libusb-1.0 # otherwise No package 'libusb-1.0' found

then for the openocd-32; make sure you do not have a regular distro version of openocd installed, if you do:
sudo apt-get remove openocd

Here too, just restating the instructions from https://github.com/espressif/openocd-esp32:
mkdir -p ~/workspace
cd ~/workspace
git clone --recursive https://github.com/espressif/openocd-esp32.git
sudo apt-get install make libtool pkg-config autoconf automake texinfo
sudo apt-get install libusb-1.0
cd openocd-esp32
./bootstrap
./configure

the default configure should show this when done:

libjaylink configuration summary:
 - Package version ................ 0.1.0
 - Library version ................ 0:0:0
 - Installation prefix ............ /usr/local
 - Building on .................... x86_64-pc-linux-gnu
 - Building for ................... x86_64-pc-linux-gnu


OpenOCD configuration summary
--------------------------------------------------
MPSSE mode of FTDI based devices        yes (auto)
Segger J-Link JTAG Programmer           yes (auto)
ST-Link JTAG Programmer                 yes (auto)
TI ICDI JTAG Programmer                 yes (auto)
Keil ULINK JTAG Programmer              yes (auto)
Altera USB-Blaster II Compatible        yes (auto)
Versaloon-Link JTAG Programmer          yes (auto)
OSBDM (JTAG only) Programmer            yes (auto)
eStick/opendous JTAG Programmer         yes (auto)
Andes JTAG Programmer                   yes (auto)
USBProg JTAG Programmer                 no
Raisonance RLink JTAG Programmer        no
Olimex ARM-JTAG-EW Programmer           no
CMSIS-DAP Compliant Debugger            no

if installing in WSL, the only difference I saw:

 - Building on .................... x86_64-unknown-linux-gnu
 - Building for ................... x86_64-unknown-linux-gnu
continue with:

make
sudo make install
openocd
The make takes a rather long time. I did observe a couple of errors/warnings on WSL (didn't notice on linux). Seems to be only related to docs. Note the "makeinfo missing":
Making install in doc
make[1]: Entering directory `/home/gojimmypi/workspace/openocd-esp32/doc'
restore=: && backupdir=".am$$" && \
        am__cwd=`pwd` && CDPATH="${ZSH_VERSION+.}:" && cd . && \
        rm -rf $backupdir && mkdir $backupdir && \
        if (echo makeinfo missing; true --version) >/dev/null 2>&1; then \
          for f in openocd.info openocd.info-[0-9] openocd.info-[0-9][0-9] openocd.i[0-9] openocd.i[0-9][0-9]; do \
            if test -f $f; then mv $f $backupdir; restore=mv; else :; fi; \
          done; \
        else :; fi && \
        cd "$am__cwd"; \
        if echo makeinfo missing; true   -I . \
         -o openocd.info openocd.texi; \
        then \
          rc=0; \
          CDPATH="${ZSH_VERSION+.}:" && cd .; \
        else \
          rc=$?; \
          CDPATH="${ZSH_VERSION+.}:" && cd . && \
          $restore $backupdir/* `echo "./openocd.info" | sed 's|[^/]*$||'`; \
        fi; \
        rm -rf $backupdir; exit $rc
makeinfo missing
make[2]: Entering directory `/home/gojimmypi/workspace/openocd-esp32/doc'
make[2]: Nothing to be done for `install-exec-am'.
restore=: && backupdir=".am$$" && \
        am__cwd=`pwd` && CDPATH="${ZSH_VERSION+.}:" && cd . && \
        rm -rf $backupdir && mkdir $backupdir && \
        if (echo makeinfo missing; true --version) >/dev/null 2>&1; then \
          for f in openocd.info openocd.info-[0-9] openocd.info-[0-9][0-9] openocd.i[0-9] openocd.i[0-9][0-9]; do \
            if test -f $f; then mv $f $backupdir; restore=mv; else :; fi; \
          done; \
        else :; fi && \
        cd "$am__cwd"; \
        if echo makeinfo missing; true   -I . \
         -o openocd.info openocd.texi; \
        then \
          rc=0; \
          CDPATH="${ZSH_VERSION+.}:" && cd .; \
        else \
          rc=$?; \
          CDPATH="${ZSH_VERSION+.}:" && cd . && \
          $restore $backupdir/* `echo "./openocd.info" | sed 's|[^/]*$||'`; \
        fi; \
        rm -rf $backupdir; exit $rc
makeinfo missing
 /bin/mkdir -p '/usr/local/share/info'
 install-info --info-dir='/usr/local/share/info' '/usr/local/share/info/openocd.info'
This is not dpkg install-info anymore, but GNU install-info
See the man page for ginstall-info for command line arguments
install-info: No such file or directory for /usr/local/share/info/openocd.info
 /bin/mkdir -p '/usr/local/share/man/man1'
As we did not previously have apt-get install openocd, we should now see version 0.10 when running it. Open On-Chip Debugger 0.10.0-dev-g372bb59 (2017-05-25-16:24)
copy the hello_world app:

export IDF_PATH=~/esp/esp-idf
cd ~/esp
cp -r $IDF_PATH/examples/get-started/hello_world .
cd ~/esp/hello_world
make menuconfig

if you have a hard time with the config window on WSL, try resizing the [Bash on Ubuntu] Windows size (typically smaller). Hit arrows up & down to screen refresh. If you see the problem you'll understand. If not - then there's no problem! :)

next, edit ~/workspace/openocd-esp32/tcl/interface/ftdi/olimex-arm-usb-ocd-h.cfg
to add the adapter_khz 1000 line (I saved mine to a file called olimex-arm-usb-ocd-h-1MHz.cfg): 
cd ~/workspace/openocd-esp32/tcl/interface/ftdi/
cp olimex-arm-usb-ocd-h.cfg  olimex-arm-usb-ocd-h-1MHz.cfg
nano olimex-arm-usb-ocd-h-1MHz.cfg

#
# Olimex ARM-USB-OCD-H
#
# http://www.olimex.com/dev/arm-usb-ocd-h.html
#
interface ftdi
ftdi_device_desc "Olimex OpenOCD JTAG ARM-USB-OCD-H"
ftdi_vid_pid 0x15ba 0x002b
ftdi_layout_init 0x0908 0x0b1b
ftdi_layout_signal nSRST -oe 0x0200
ftdi_layout_signal nTRST -data 0x0100
ftdi_layout_signal LED -data 0x0800 

adapter_khz 1000
I also slightly modified my esp32.cfg file (thanks @ba0sh1 http://ba0sh1.com/)
cd ~/workspace/openocd-esp32/tcl/target/
cp esp32.cfg ESP32-RTOS-none.cfg
just one change needed to set ESP32_RTOS none, but the whole file shown for reference.

As a reminder, don't try to uncomment a setting and leave a comment at the end of the same line. I saved mine to: ~/workspace/openocd-esp32/tcl/target/ESP32-RTOS-none.cfg

#With no variables set, openocd will configure JTAG for the two cores of the ESP32 and
#will not automatic RTOS detection. This can be be adjusted:

#set ESP32_ONLYCPU 1        # Only configure the PRO CPU
#set ESP32_ONLYCPU 2        # Only configure the APP CPU

# Disable RTOS support
set ESP32_RTOS none        

#set ESP32_RTOS freertos    # Force RTOS to be FreeRTOS

if { [info exists CHIPNAME] } {
 set _CHIPNAME $CHIPNAME
} else {
 set _CHIPNAME esp32
}

if { [info exists CPUTAPID] } {
 set _CPUTAPID $CPUTAPID
} else {
 set _CPUTAPID 0x120034e5
}

if { [info exists ESP32_RTOS] } {
 set _RTOS "$ESP32_RTOS"
} else {
 set _RTOS "auto"
}

if { [info exists ESP32_ONLYCPU] } {
 set _ONLYCPU $ESP32_ONLYCPU
} else {
 set _ONLYCPU 3
}

proc esp_core_halt { tgt } {
 #We need to disable the watchdogs here.
 #TIMG1 WDT
 $tgt mww 0x3FF5F064 0x50D83AA1
 $tgt mww 0x3FF5F048 0x0
 #TIMG2 WDT
 $tgt mww 0x3FF60064 0x50D83AA1
 $tgt mww 0x3FF60048 0x0
 #RTC WDT
 #ToDo: Figure out how to kill the RTC WDT
}

proc configure_esp32_core { TGT } {
 $TGT configure -event halted [list esp_core_halt $TGT]
}

#Change the name of the CPU taps depending on if it's enabled or not. This way, the user
#gets immediate feedback in the openocd logs.
if { $_ONLYCPU == "1" } {
 set _CPU0NAME cpu0
 set _CPU1NAME ignored
} elseif { $_ONLYCPU == "2" } {
 set _CPU0NAME ignored
 set _CPU1NAME cpu1
} else {
 set _CPU0NAME cpu0
 set _CPU1NAME cpu1
}

#Do add both taps, even if one of the CPUs is disabled.
jtag newtap $_CHIPNAME $_CPU0NAME -irlen 5 -expected-id $_CPUTAPID
jtag newtap $_CHIPNAME $_CPU1NAME -irlen 5 -expected-id $_CPUTAPID
set _TARGETNAME1 $_CHIPNAME.cpu1
set _TARGETNAME2 $_CHIPNAME.cpu0

if { $_ONLYCPU != 2 } {
 if { $_RTOS == "none" } {
  target create $_TARGETNAME2 esp108 -endian little -chain-position $_TARGETNAME2
 } else {
  target create $_TARGETNAME2 esp108 -endian little -chain-position $_TARGETNAME2 -rtos $_RTOS
 }
 configure_esp32_core $_TARGETNAME2
}
if { $_ONLYCPU != 1 } {
 if { $_RTOS == "none" } {
 target create $_TARGETNAME1 esp108 -endian little -chain-position $_TARGETNAME1
 } else {
 target create $_TARGETNAME1 esp108 -endian little -chain-position $_TARGETNAME1 -rtos $_RTOS
 }
 if { $_ONLYCPU != 3 } {
  configure_esp32_core $_TARGETNAME1
 }
}


#Force hw breakpoints. Once we have a memory map, we can also allow software bps.
gdb_breakpoint_override hard


Tips and Suggestions:


Note that when moving between Windows and Linux... if you use VSCode to create bash script files from Windows, there's a little issue with the LF vs CRLF settings. (note the little LF in the status bar at the bottom of the screen). You really only want to save files with LF on Linux, not CRLF like on Windows. If you ignore this, you'll may see an err like Not able to execute a .sh file: /bin/bash^M: bad interpreter. The CRLF's are to blame. The linux dosa2unix utility might also be helpful.

Is it working? 

See my gist or use this set of commands:
export PATH=$PATH:$HOME/esp/xtensa-esp32-elf/bin
export IDF_PATH=~/esp/esp-idf

cd  ~/workspace/openocd-esp32/tcl
sudo openocd -f interface/ftdi/olimex-arm-usb-ocd-h-1MHz.cfg -c "transport select jtag"  -f target/ESP32-RTOS-none.cfg

Continued in step 2...

Resources and Inspiration:

Interesting but not really related:


(this is still a work in progress, sorry for spelling / formatting / content)

Continued in step 2....

Tuesday, May 9, 2017

VSCode Remote Debugging of Embedded Devices

The developers for Visual Studio Code continue to amaze me by implementing really awesome features. This latest feature is remote OpenOCD / GDB debugging!

As mentioned in a previous post, I've been really enjoying the  OpenDPS Programmable Power Supply project introduced by Johan. This has been a really cool and fun learning opportunity.

Recently, I was able to get an OpenOCD / GDB session running on Ubuntu to do single-step debugging. If you've ever used gdb on a linux machine, even with the tui ... well, it is really cool, but when coming from the world of Visual Studio, there are a lot of cool IDE features missing.

I've tried Visual Micro and really like that environment. The drawback is that (at least at the time) there was no JTAG debugging. I noticed a recent update mentions that, so I need to revisit. Another drawback is that it is *very* Arduino specific. So embedded apps that use other libraries - say FreeRTOS - are practically impossible to load up, compile, and debug.

Another major player in the Visual Studio IDE world is the SysProgs VisualGDB add-in app. It is a considerably more serious debugger supporting JTAG and more... alas there's *no* current or even planned Arduino library support. I really like the Arduino world. I have several ESP8266 and soon ESP32 projects that use Arduino-style code libraries. Adafruit in particular has a ton of really cool open source ESP8266 libraries and sample code.

Enter VSCode. WOW! It supports gdb debugging! And shockingly easily!

First, make sure you have the VSCode ms-vscode.cpptools add-in installed.

Browse to the source code directory of your embedded app. In my case, I have my "Z:" drive mapped to a VM hosting Ubuntu (I have samba installed there).

net use z: \\192.168.8.130\c$\

It seems to be very important to use the same full path on Windows as Linux, as this process seems to see the full path on the Linux side for debugging, so Windows needs to have the same respective path starting at the root  (e.g. in my case /home/gojimmypi/ ).

I keep my projects in a directory called ~/workspace. My OpenDPS project directory is thus:

Z:/home/gojimmypi/workspace/opendps/opendps/

Right click on the directory in Windows File Explorer and click "Open with Code". From VSCode, click on Debug - Add Configuration. Then select "C++ (GDB/LLDB)". A template comes up, ready to be filled in, but perhaps not the most intuitive the first time.

Here's my complete launch.json that you could purge / edit & replace the default template:
{
    "version": "0.2.0",
    "configurations": [

        {
            "name": "Debug",
            "type": "cppdbg",
            "request": "launch",
            "miDebuggerPath": "C:/workspace/opendps/opendps/arm-none-eabi-gdb.exe",
            "targetArchitecture": "arm",
            "program": "Z:/home/gojimmypi/workspace/opendps/opendps/opendps.elf",

            "setupCommands": [
            {
                "text": "file Z:/home/gojimmypi/workspace/opendps/opendps/opendps.elf"
            },
            {
                "text": "target remote 192.168.8.130:3333"
            },
            {
                "text": "monitor reset init"
            }
                
            ],
            "externalConsole": false,
            "cwd": "Z:/home/gojimmypi/workspace/opendps/opendps/"
            }
    ]
}

I had some initial difficulties as noted in issue 706 on gitthub, so be sure to take note of the forward slashes (not back-slashes!) when editing the file paths.

Note that I have OpenOCD running on the Ubuntu VM (192.168.8.130) and I am using an ST-Link V2 JTAG debugger interface, launched in a putty terminal window like this:

  cd ~/workspace/opendps/openocd/scripts
  sudo openocd -f interface/stlink-v2.cfg -f target/stm32f1x.cfg


I have more details on Ubuntu OpenOCD in my prior post here.

Additionally, I also have Atmel Studio 7 installed, and I am using their arm-none-eabi-gdb.exe file located here:

C:/Program Files (x86)/Atmel/Studio/7.0/toolchain/arm/arm-gnu-toolchain/bin/arm-none-eabi-gdb.exe

Note that one of the things I did was copy the arm-none-eabi-gdb.exe executable to the project directory (so as to have no spaces in path). There's no problem with spaces in the path, just the forward vs back slash issue.

If you don't have (and don't want) Atmel Studio installed, you could try to install the Windows GNU ARM Embedded Toolchain located here:

https://developer.arm.com/open-source/gnu-toolchain/gnu-rm/downloads

Once everything is step, simply press "F5" to start debugging in VSCode! Some gdb commands result in errors, including important ones like "n" and "s" for stepping. So be sure and use the icons at the top of the screen. You'll probably want to press pause first if there are no break points.


Even more cool - is just like Visual Studio - you can hover over many variables while paused, and SEE THE VALUES in the hover text! No real big deal in Visual Studio, but VSCode via GDB and OpenOCD to a remote embedded device is really quite cool.  :)


This is simply amazing!

See also: "Configuring launch.json for C/C++ debugging" here:

https://github.com/Microsoft/vscode-cpptools/blob/master/launch.md


Additional resources:

https://code.visualstudio.com/docs/editor/debugging

https://code.visualstudio.com/docs/languages/cpp#_debugging

https://developer.arm.com/open-source/gnu-toolchain/gnu-rm/downloads

https://code.visualstudio.com/docs/editor/tasks

https://github.com/Microsoft/vscode-cpptools/issues/682


Using OpenOCD and GDB

Reverse engineering an existing STM32 hardware device.

I first started reverse engineering the STM32 based programmable power supply as described in a prior blog post. The more I dug into Johan's code, the more impressed I became. There's a real gem stashed away in his project: the ocd-client.py utility. This is a work of genius!

Rather than play on my only DPS, I instead did some experimenting using the STM32_Smart V2 device, with a simple blink app installed.

I learned how to use OpenOCD with GDB with the UDemy class by Peter Dalmaris called Advanced Arduino Boards and Tools. Although this was an Arduino-specific class - the instructions are the same for the STM32 devices.

First, the OpenOCD server needs to be running (in this case with the Segger J-Link):


cd ~/workspace/opendps/openocd/scripts
sudo openocd -f interface/jlink.cfg -f target/stm32f1x.cfg

# or

sudo openocd -f interface/stlink-v2.cfg -f target/stm32f1x.cfg


With no other OpenOCD client connected (e.g. gdb not running!), we can inspect the GPIO Port C  like this:

cd ~/workspace/opendps
./ocd-client.py gpioc

That command should return something like this:

GPIOC settings
CRL      : 0x44444444  [0x40011000]
CRH      : 0x44344444  [0x40011004]
IDR      : 0x0000e000  [0x40011008]
ODR      : 0x00002000  [0x4001100c]
BSRR     : 0x00000000  [0x40011010]
BRR      : 0x00000000  [0x40011014]
LCKR     : 0x00000000  [0x40011018]

launch gdb. Note that a special one called "arm-none-eabi-gdb" is needed. I think gdb is really best with the "-tui" (text user interface) option turned on. Although not as cool as a full featured IDE such as Visual Studio, it is an impressive little text-based debugger.


cd ~/workspace/opendps/opendps
arm-none-eabi-gdb -d ./ -f opendps.elf -tui

then from the gdb prompt:


target remote localhost:3333
monitor reset init

If more source code is desired (beyond that in the app itself), in Ubunto go to "System settings - Software and Updates"


and be sure "source" is selected:

without the "Source code" checkbox, you'll see an error like:

E: You must put some 'source' URIs in your sources.list

WITH that setting, then you can do things like:


sudo apt-get build-dep gcc
sudo apt-get build-dep libusb-1.0-0-dev
sudo apt-get build-dep  gcc-arm-none-eabi

# this next command will typically install source code in your
# $USER\gcc-arm-none-eabi-4.9.3+svn231177
sudo apt-get source  gcc-arm-none-eabi


then in gdb:


directory  gcc-arm-none-eabi-4.9.3+svn231177/src/libgcc/config/arm


I used that include directory as "ctrl-c" would typically break in this file:

../../../../src/libgcc/config/arm/ieee754-df.S


MYLOG=~/toolchain.log
sudo apt-get update  --assume-yes | tee -a $MYLOG

sudo apt-get install ssh  --assume-yes
sudo apt-get install xrdp  --assume-yes
sudo apt-get install samba samba-common-bin  --assume-yes
sudo apt-get install fail2ban  --assume-yes

sudo apt-get install binutils  --assume-yes
sudo apt-get install gcc  --assume-yes
sudo apt-get install gdb  --assume-yes
sudo apt-get install make  --assume-yes

sudo apt-get install build-essential  --assume-yes

sudo apt-get install python  --assume-yes

sudo apt-get install gawk  --assume-yes

(TODO - I plan to put the whole toolchain script on github)

Additional resources and inspiration:

Friday, May 5, 2017

Converting OpenDPS to Visual Studio with VisualGDB

minimal description supporting thread at sysprogs forum.

see: https://sysprogs.com/w/forums/topic/visualgdb-manual-import-failure-2-separate-compiles/

come back soon. I'll post more details when I have this working :)

Compile on Ubuntu VM...


(compiles successfully)
 
(also compiles successfully)


Starting OpenOCD


Separate telnet session... flashing to hardware via OpenOCD


Windows drive map to VM


If instead following the same instructions and using VS 2015:

make: *** No targets specified and no makefile found. Stop.

 1>C:\Program Files (x86)\MSBuild\Microsoft.Cpp\v4.0\V140\Microsoft.MakeFile.Targets(46,5): error MSB3073: The command ""C:\Program Files (x86)\Sysprogs\VisualGDB\\VisualGDB.exe" /rebuild "c:\workspace\opendps-import15\opendps-import15\opendps-import15.vcxproj" "/solution:c:\workspace\opendps-import15\opendps-import15.sln" "/config:Debug" "/platform:Win32"" exited with code 1.


also tried "ARM" and "VisualGDB" platforms, same result:


Find gojimmypi at gojimmypi.github.io

I'm currently working on my new blog home at  gojimmypi.github.io After implementing a variety of features such as dark mode , syntax hi...