Saturday, February 11, 2017

VisualGDB vgagent.exe went missing - Norton thinks it is a virus

This morning my VisualGDB starting giving me problems with weird error messages about a missing file called vgagent.exe

Rather than fuss with it, I decided might as well re-install - as I noticed there was an incrementally newer version available. So I downloaded VisualGDB-5.2r8-trial.msi (the previous one I downloaded was VisualGDB-5.2r7-trial.msi from January) from the Sysprogs VisualGDB download page.

All installed successfully and I was able to resume my attempts at getting my Segger JTAG to debug the ESP8266 (which I did!)

After taking a break for a few hours, when I returned Norton Anti-virus had popped an alert that it had detected Heur.AdvML.B 


and this screen snip of the prior removal of the same-name file just yesterday:


googling Heur.AdvML.B and there appears to be many suspect bait-and-infect links (so be careful when clicking).

There's also a thread on the Norton forum that questions whether these are false positives:


I've posted this question on the syslogs forum (hopefully it is indeed simply a false positive).


ESP8266 JTAG Debugging in Visual Studio with Segger J-Link and Sysprogs VisualGDB

My go-to development tool so far for the ESP8266 is still the Visual Micro add-in for Visual Studio. It is however a pure software environment, that supports breakpoints, but in a different way. It is also a little odd in the way that it uses the Arduino environment - yes, in Visual Studio. But it works. Reliably. Consistently.

With my newfound confidence in getting J-Tag debugging working with the Olimex ESP8266 I decided to revisit the first unit I bought - the Segger J-Link.

Let's first start by noticing the ESP8266 is nowhere to be found on the Segger supported device list page.  But it is a standard JTAG device that when adhering to standards, Should work, no? Besides, I always enjoy a challenge.

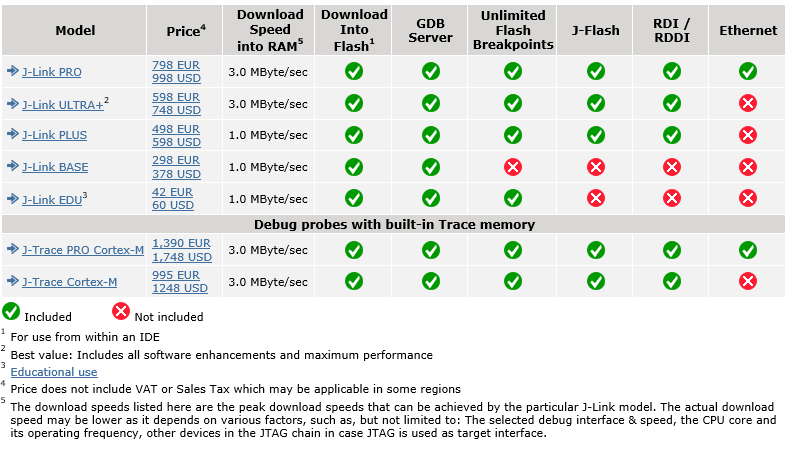
It is cool Segger has an EDU (Educational) version for only $60(USD).  A large discount over their base unit of $378, and massive discount compared to their $1000 J-Link Pro, (with of course different capabilities). Here's a screen snip from their web site comparing versions.  (or visit the Segger Model Overview page for a more detailed comparison).


I really like that the EDU version is available to any hobbyist, not just students - just provided that you are not using it to make a commercial product for profit. Segger explains more on the terms of the EDU version on their web site. One thing to note is that there's no support other than forum questions.

The Olimex ARM-USB-OCD-H/ unit is also available for about $60 from Mouser Electronics - but they do not appear to have other more advanced units with more features. The Segger with Ethernet could be a really cool device to have one day....

So yes, I'm over $120 into a couple of hardware debuggers that I intend to use with a $3 ESP8266.

I first tried connecting my Segger to a NodeMCU with no success. VisualGSB seemed happy with the JTAG interface at project setup / test time, but not when actually programming.

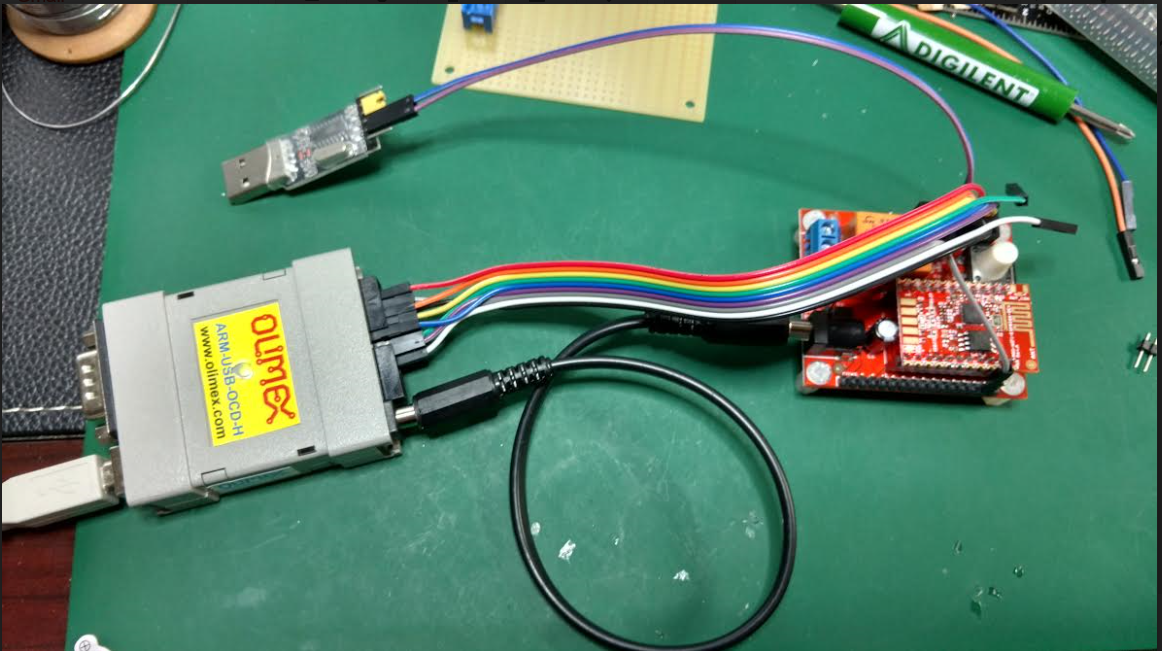
For an easy increment step - I'll revisit prgramminh the $9 Olimex ESP8266 EVB shown in the SysProgs VisualGDB ESP8266 Tutorial, using the same pins:


The first thing that was immediately obvious, is that I like the Olimex having its own 5V power supply for their EDP8266 EVB board. The Segger does not have a power supply connector, however on page 420 of the J-Link manual - "Pin 19 of the connector can be used to supply power to the target hardware. Supply voltage is 5V, max. current is 300mA. The output current is monitored and protected against overload and short-circuit. Power can be controlled via the J-Link commander". I could not find the specs on the ESP8266-EVB (surely it is less than 300mA, eh?) - but I used a separate power supply for the Olimex ESP8266-EVB.

For reference: Pages 418 and 419 of the Segger manual* shows this table of JTAG pin definitions:


* (I've requested permission from Segger to include this)

As noted in my previous blog, I am following the Syslogs VisualGDB ESP8266 OpenOCD tutorial.

Success! The Segger *does* work in the same way as the Olimex ARM-USB-OCD-H to debug the ESP8266 - but my target is still the Olimex ESP8266-EVB.  I really want to get debugging working on the NodeMCU as noted in this long and winding forum topic.


Saturday, February 4, 2017

ESP8266 JTAG Debugging in Visual Studio with Olimex ARM-USB-OCD-H and Sysprogs VisualGDB

To date, my go-to development environment - in Visual Studio 2015, is the VisualMicro add-in. There's no hardware debugging, but I've found it easy to use and reliable.

However, I've been interested on getting JTAG ESP8266 hardware debugging working in Visual Studio using the Sysprogs VisualGDB add-in - with mixed results.

I started with the Altera Bus Blaster than I already had on hand for programming Arduino. (hint: don't bother, it won't work: no reset control - see this discussion )

There are several tutorials, some not really up to date, but each with interesting information:

Developing projects for the ESP8266 WiFi chip with Visual Studio - August 24, 2015
Debugging ESP8266 firmware with Olimex ARM-USB-OCD-H - September 9, 2015
Debugging ESP8266 firmware with the UART GDB Stub - October 14, 2015
Debugging ESP8266 code with OpenOCD and Visual Studio - November 5, 2015

First, just figuring out which JTAG debugging hardware to buy: first I tried the Segger (kudos to them for having a generous discount for people not developing to sell a product). The Sysprogs folks then recommended that I follow the tutorial exactly, by using an Olimex instead. Another week into my 30 day trial and Mouser Electronics to the rescue with an ARM-USB-OCD-H debugger delivered. The price was about the same as the EDU version of the Segger. (approx. $60)

I had problems even finding the ESP8266 Xtensa-LX 106 elf for GDB stub (hint, it does not display in the directory shown in tutorial!) 

I also had problems with the interesting feature to debug existing project.

In the end I did get the debugging working.

I have this video on Creating Olimex VisualGDB Embedded Project for ESP8266 :


and this video on JTAG Debugging ESP8266 with Olimex and VisualGDB


 (they are separate as Windows 10 feature "Windows Key + G" video recording does not record pop-up dialog boxes)

Here are the pinouts of the Olimex ARM-USB-OCD-H 20-pin JTAG connector and the Olimex ESP8266-EVB ESP8266 10 pin header:


Here's also a partial Olimex schematic of interest:


My setup looks like this:


Now that I have this working with the Olimex version of the ESP8266... on to trying to do this with the NodeMCU version!

I'll be posting updates on twitter with source code on GitHub.


Find gojimmypi at gojimmypi.github.io

I'm currently working on my new blog home at  gojimmypi.github.io After implementing a variety of features such as dark mode , syntax hi...