Test drive of OpenOCD WIP branch with VSCode. See: https://github.com/espressif/openocd-esp32/wiki/Work-in-progress-ESP32-dual-core-target
If there's already an openocd-esp32 checked out, save it:
cd ~/workspace
mv openocd-esp32 openocd-esp32-master
Fetch the WIP branch
cd ~/workspace
git clone -b feature/esp32_dualcore  --recursive https://github.com/espressif/openocd-esp32.git
cd openocd-esp32
git status
./bootstrap
./configure
make
sudo make install
Modified esp32_dc.cfg to esp32_dcx.cfg
cp /./home/gojimmypi/workspace/openocd-esp32/esp32_dc.cfg /./home/gojimmypi/workspace/openocd-esp32/esp32_dcx.cfg
# Example configuration file to hook up an ESP32 module or board to a JTAG
# adapter. Please modify this file to your local setup.

# Include the configuration for the JTAG adapter.
# By default, DevKit-J is used.
# Later versions of DevKit-J are known as ESP-WROVER-KIT,
# they can work with the same configuration file.
# If you use a different interface, please edit this to include the
# configuration file of yours.
# source [find interface/ftdi/esp32_devkitj_v1.cfg]

# The ESP32 only supports JTAG.
transport select jtag

# The speed of the JTAG interface, in KHz. If you get DSR/DIR errors (and they
# do not relate to OpenOCD trying to read from a memory range without physical
# memory being present there), you can try lowering this.
# On DevKit-J, this can go as high as 20MHz if CPU frequency is 80MHz, or 26MHz
# if CPU frequency is 160MHz or 240MHz.
adapter_khz 1000

#Source the ESP32 configuration file
source [find target/esp32_dc.cfg]

# The TDI pin of ESP32 is also a bootstrap pin that selects the voltage the SPI flash
# chip runs at. When a hard reset happens (e.g. because someone switches the board off
# and on) the ESP32 will use the current TDI value as the bootstrap value because the
# JTAG adapter overrides the pull-up or pull-down resistor that is supposed to do the
# bootstrapping. These lines basically set the idle value of the TDO line to a
# specified value, therefore reducing the chance of a bad bootup due to a bad flash
# voltage greatly.

# Enable this for 1.8V SPI flash
#esp32 flashbootstrap 1.8
# Enable this for 3.3V SPI flash
esp32 flashbootstrap 3.3
Note there's a discussion for openocd-esp32/issues/6 that mentions the flash voltage in config file:
That depends on the module which is used on the dev board. Most WROOM modules use 3.3V flash, while WROVER modules use 1.8V flash.
For a JTAG debugger, I'm using the Olimex (default file, see esp32 config for some settings). I could not get the default 20MHz to work, so lower this setting if there are problems. Sample above is using 1MHz, but I have been able to get 10MHz to work reliably. Actual max speed will depend on JTAG cable type characteristics (length, capacitance, shielding, etc)
#
# Olimex ARM-USB-OCD-H
#
# http://www.olimex.com/dev/arm-usb-ocd.html
#

interface ft2232
ft2232_device_desc "Olimex OpenOCD JTAG ARM-USB-OCD-H"
ft2232_layout olimex-jtag
ft2232_vid_pid 0x15ba 0x002b{
"version": "0.2.0",
"configurations": [
{
"name": "OpenOCD Debug",
"type": "cppdbg",
"request": "launch",
"miDebuggerPath": "C:/msys32/opt/xtensa-esp32-elf/bin/xtensa-esp32-elf-gdb.exe",
"program": "Y:/home/gojimmypi/esp/hello_world/build/hello-world.elf",
"setupCommands": [
{
"description": "Enable pretty-printing for gdb",
"text": "-enable-pretty-printing",
"ignoreFailures": true
},
{
"text": "file 'Y:/home/gojimmypi/esp/hello_world/build/hello-world.elf'"
},
{
"text": "target remote 192.168.174.130:3333"
},
{
"text": "monitor reset halt"
},
{
"text": "thb app_main"
},
{
"text": "x $a1=0"
}
],
"externalConsole": false,
"cwd": "Y:/home/gojimmypi/esp/hello_world/build/",
"logging": {
"trace": true,
"traceResponse": true,
"engineLogging": true
}
}
]
}
cd ~/workspace/openocd-esp32/tcl
sudo openocd -f interface/ftdi/olimex-arm-usb-ocd-h.cfg  -f ~/workspace/openocd-esp32/esp32_dcx.cfg
Open On-Chip Debugger 0.10.0-dev-gc83a89c (2017-06-09-11:42)
Licensed under GNU GPL v2
For bug reports, read
        http://openocd.org/doc/doxygen/bugs.html
adapter speed: 1000 kHz
force hard breakpoints
Info : clock speed 1000 kHz
Info : JTAG tap: esp32.cpu0 tap/device found: 0x120034e5 (mfg: 0x272 (Tensilica), part: 0x2003, ver: 0x1)
Info : JTAG tap: esp32.slave tap/device found: 0x120034e5 (mfg: 0x272 (Tensilica), part: 0x2003, ver: 0x1)
Info : Target halted. PRO_CPU: PC=0x4008495D (active)    APP_CPU: PC=0x00000000
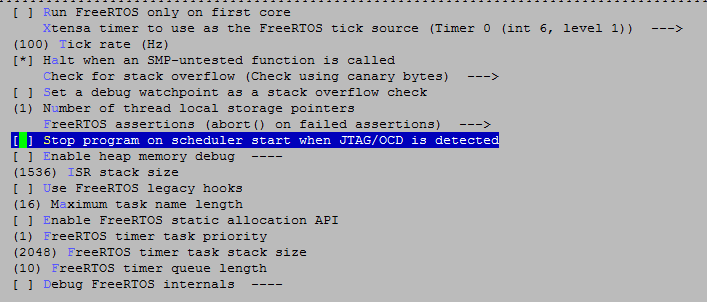
Note FreeRTOS change for app: Disable "Stop program on scheduler start..."
cd ~/esp/hello_world
export PATH=$PATH:$HOME/esp/xtensa-esp32-elf/bin
export IDF_PATH=~/esp/esp-idf
make menuconfig
Rebuild and flash. Note I edited my Hello World to loop and not reset.
make clean
make
make flash
make monitor
MONITOR
--- idf_monitor on /dev/ttyUSB0 115200 ---
--- Quit: Ctrl+] | Menu: Ctrl+T | Help: Ctrl+T followed by Ctrl+H ---
ets Jun  8 2016 00:22:57

rst:0x1 (POWERON_RESET),boot:0x13 (SPI_FAST_FLASH_BOOT)
ets Jun  8 2016 00:22:57

rst:0x10 (RTCWDT_RTC_RESET),boot:0x13 (SPI_FAST_FLASH_BOOT)
configsip: 0, SPIWP:0x00
clk_drv:0x00,q_drv:0x00,d_drv:0x00,cs0_drv:0x00,hd_drv:0x00,wp_drv:0x00
mode:DIO, clock div:2
load:0x3fff0008,len:8
load:0x3fff0010,len:4400
load:0x40078000,len:11092
ho 0 tail 12 room 4
load:0x40080000,len:252
0x40080000: _iram_start at ??:?

entry 0x40080034
0x40080034: _iram_start at ??:?

I (49) boot: ESP-IDF v2.0-rc1-854-gba55461 2nd stage bootloader
I (49) boot: compile time 13:14:19
I (49) boot: Enabling RNG early entropy source...
I (67) boot: SPI Speed      : 40MHz
I (79) boot: SPI Mode       : DIO
I (92) boot: SPI Flash Size : 4MB
I (104) boot: Partition Table:
I (115) boot: ## Label            Usage          Type ST Offset   Length
I (138) boot:  0 nvs              WiFi data        01 02 00009000 00006000
I (161) boot:  1 phy_init         RF data          01 01 0000f000 00001000
I (185) boot:  2 factory          factory app      00 00 00010000 00100000
I (208) boot: End of partition table
I (221) boot: Disabling RNG early entropy source...
I (238) boot: Loading app partition at offset 00010000
I (753) boot: segment 0: paddr=0x00010018 vaddr=0x00000000 size=0x0ffe8 ( 65512)
I (753) boot: segment 1: paddr=0x00020008 vaddr=0x3f400010 size=0x070ac ( 28844) map
I (769) boot: segment 2: paddr=0x000270bc vaddr=0x3ffb0000 size=0x02b00 ( 11008) load
I (800) boot: segment 3: paddr=0x00029bc4 vaddr=0x40080000 size=0x00400 (  1024) load
0x40080000: _iram_start at ??:?

I (822) boot: segment 4: paddr=0x00029fcc vaddr=0x40080400 size=0x12cdc ( 77020) load
I (885) boot: segment 5: paddr=0x0003ccb0 vaddr=0x400c0000 size=0x00000 (     0) load
I (886) boot: segment 6: paddr=0x0003ccb8 vaddr=0x00000000 size=0x03350 ( 13136)
I (906) boot: segment 7: paddr=0x00040010 vaddr=0x400d0018 size=0x26ae8 (158440) map
0x400d0018: _flash_cache_start at ??:?

I (932) cpu_start: Pro cpu up.
I (943) cpu_start: Starting app cpu, entry point is 0x40080ec0
0x40080ec0: call_start_cpu1 at /home/gojimmypi/esp/esp-idf/components/esp32/./cpu_start.c:174

I (0) cpu_start: App cpu up.
I (976) heap_alloc_caps: Initializing. RAM available for dynamic allocation:
I (998) heap_alloc_caps: At 3FFAE2A0 len 00001D60 (7 KiB): DRAM
I (1018) heap_alloc_caps: At 3FFB6418 len 00029BE8 (166 KiB): DRAM
I (1039) heap_alloc_caps: At 3FFE0440 len 00003BC0 (14 KiB): D/IRAM
I (1061) heap_alloc_caps: At 3FFE4350 len 0001BCB0 (111 KiB): D/IRAM
I (1082) heap_alloc_caps: At 400930DC len 0000CF24 (51 KiB): IRAM
I (1103) cpu_start: Pro cpu start user code
I (1161) cpu_start: Starting scheduler on PRO CPU.
Hello world!
I (201) cpu_start: Starting scheduler on APP CPU.
This is ESP32 chip with 2 CPU cores, WiFi/BT/BLE, silicon revision 0, 4MB external flash
Looping in 10 seconds...
Looping in 9 seconds...
Looping in 8 seconds...
Looping in 7 seconds...
Looping in 6 seconds...
On Windows machine, my Y: drive is mapped to the root of the Ubuntu machine (using samba):
net use y: \\192.168.174.130\c$
Y:\home\gojimmypi\esp\hello_world\buildPress F5 to debug! Tada!

VSCode immediately fails with this error if the last line is included in launch.json as noted for gdbinit: (so don't add it that last "c" command)

Unable to start debugging. Unexpected GDB output from command "-interpreter-exec console "c"".
1: (138) LaunchOptions
1: (143) LaunchOptions
1: (143) LaunchOptions
1: (144) LaunchOptions
1: (176) Starting: "C:/msys32/opt/xtensa-esp32-elf/bin/xtensa-esp32-elf-gdb.exe" --interpreter=mi
1: (189) DebuggerPid=22492
1: (216) ->=thread-group-added,id="i1"
1: (217) ->~"GNU gdb (crosstool-NG crosstool-ng-1.22.0-61-gab8375a) 7.10\n"
1: (217) ->~"Copyright (C) 2015 Free Software Foundation, Inc.\n"
1: (217) ->~"License GPLv3+: GNU GPL version 3 or later \nThis is free software: you are free to change and redistribute it.\nThere is NO WARRANTY, to the extent permitted by law. Type \"show copying\"\nand \"show warranty\" for details.\n"
1: (217) ->~"This GDB was configured as \"--host=i686-host_pc-mingw32 --target=xtensa-esp32-elf\".\nType \"show configuration\" for configuration details."
1: (217) ->~"\nFor bug reporting instructions, please see:\n"
1: (217) ->~".\n"
1: (217) ->~"Find the GDB manual and other documentation resources online at:\n.\n"
1: (217) ->~"For help, type \"help\".\n"
1: (217) ->~"Type \"apropos word\" to search for commands related to \"word\".\n"
1: (217) ->(gdb)
1: (222) <-1001-gdb-set -="" 1:="" on="" target-async="">1001^done
1: (228) ->(gdb)
1: (229) 1001: elapsed time 6
1: (234) <-1002-enable-pretty-printing -="" 1:="">1002^done
1: (239) ->(gdb)
1: (239) 1002: elapsed time 5
1: (241) <-1003-interpreter-exec -="" 1:="" build="" console="" esp="" file="" gojimmypi="" hello-world.elf="" hello_world="" home="">~"Reading symbols from Y:/home/gojimmypi/esp/hello_world/build/hello-world.elf..."
1: (274) ->~"done.\n"
1: (275) ->1003^done
1: (275) ->(gdb)
1: (275) 1003: elapsed time 34
1: (275) <-1004-interpreter-exec -="" 192.168.174.130:3333="" 1:="" console="" remote="" target="">~"Remote debugging using 192.168.174.130:3333\n"
1: (305) ->=thread-group-started,id="i1",pid="42000"
1: (305) ->=thread-created,id="1",group-id="i1"
1: (307) ->~"0x00000000 in ?? ()\n"
1: (307) ->*stopped,frame={addr="0x00000000",func="??",args=[]},thread-id="1",stopped-threads="all"
1: (309) ->1004^done
1: (309) ->(gdb)
1: (318) 1004: elapsed time 42
1: (319) <-1005-thread-info -="" 1:="" 1="">1005^done,threads=[{id="1",target-id="Remote target",frame={level="0",addr="0x00000000",func="??",args=[]},state="stopped"}]
1: (329) ->(gdb)
1: (330) 1005: elapsed time 11
1: (330) <-1006-interpreter-exec -="" 1:="" console="" e="" halt="" monitor="" reason="" reset="" started="" thread:="" thread="" threadid="" type="">@"JTAG tap: esp32.cpu0 tap/device found: 0x120034e5 (mfg: 0x272 (Tensilica), part: 0x2003, ver: 0x1)\n"
1: (366) ->@"JTAG tap: esp32.slave tap/device found: 0x120034e5 (mfg: 0x272 (Tensilica), part: 0x2003, ver: 0x1)\n"
1: (490) ->@"Target halted. PRO_CPU: PC=0x400D0E1C (active) APP_CPU: PC=0x00000000 \n"
1: (500) ->@"esp32: target state: halted\n"
1: (542) ->@"esp32: Debug controller was reset (pwrstat=0x5F, after clear 0x0F).\n"
1: (542) ->@"esp32: Core was reset (pwrstat=0x5F, after clear 0x0F).\n"
1: (676) ->@"Target halted. PRO_CPU: PC=0x5000004B (active) APP_CPU: PC=0x00000000 \n"
1: (691) ->@"esp32: target state: halted\n"
1: (740) ->@"esp32: Core was reset (pwrstat=0x1F, after clear 0x0F).\n"
Even when things seem to be going well, eventually some errors are encountered. If you try to debug and nothing happens, it may be because there are too many breakpoints. The limit is TWO! But perhaps you don't know / remember you even have breakpoints, but see this in the View - Debug Console
1: (1048) <-1020-interpreter-exec -="" 1:="" console="" info="" sharedlibrary="">~"No shared libraries loaded at this time.\n"
1: (1051) ->1020^done
1: (1051) ->(gdb)
1: (1051) 1020: elapsed time 3
E output: {"category":"console","output":"Loaded 'shared libraries loaded at this time.'. Cannot find or open the symbol file.\r\n","data":null,"type":"output"}
Loaded 'shared libraries loaded at this time.'. Cannot find or open the symbol file.
1: (1061) <-1021-thread-info -="" 1:="">1021^done,threads=[{id="1",target-id="Remote target",frame={level="0",addr="0x40000400",func="??",args=[]},state="stopped"}],current-thread-id="1"
1: (1072) ->(gdb)
1: (1072) 1021: elapsed time 11
1: (1078) <-1022-stack-list-frames -="" 0="" 1000="" 1:="">1022^done,stack=[frame={level="0",addr="0x40000400",func="??"}]
1: (1083) ->(gdb)
1: (1083) 1022: elapsed time 4
1: (1086) <--exec-continue -="" 1:="">^error,msg="Warning:\nCannot insert breakpoint 3.\nCannot access memory at address 0x400f4d55\nCannot insert breakpoint 4.\nCannot access memory at address 0x400f4d75\n"
1: (1104) ->(gdb)
E output: {"category":"stderr","output":"ERROR: Warning:\nCannot insert breakpoint 3.\nCannot access memory at address 0x400f4d55\nCannot insert breakpoint 4.\nCannot access memory at address 0x400f4d75\n\r\n","data":null,"type":"output"}
ERROR: Warning:
Cannot insert breakpoint 3.
Cannot access memory at address 0x400f4d55
Cannot insert breakpoint 4.
Cannot access memory at address 0x400f4d75


