
A little while back, I responded to an offer to get a free Sino:bit from the nice folks at Elecrow. Well, it was not completely free; I paid $4 for shipping from China, as it was not really practical for me to pick it up. ;)
In case you've not heard - this is the Chinese version of the BBC Micro:bit - or more precisely, based on the Calliope mini, which is based on the Micro:bit. Me... I'm in favor of pretty much any technology that may help inspire the next generation of programmers.
Although there are a variety of ways to program this device, I followed along with the Adafruit instructions to use the Arduino IDE (and/or the VisualMicro add-in for Visual Studio).
Initial programming was really quite easy. There was one little instruction missing from the Adafruit site. Hopefully they will notice my tweet and make the correction. In short, the Arduino HT1632 libraries need to be manually added. So if you see an error like this:

...then simply add the library:

I like to turn on verbose compiling and uploading:

When doing so, a successful upload will look like this:

In particular, I noticed that a forked version of Open OCD is used to upload the sketch. The first thing that comes to mind when mentioning OpenOCD, is of course GDB! So I thought I'd see if I could get some single-step debugging working without the need for a potentially expensive hardware debugger.
One line to notice during the verbose compile / upload is the last line of the compile. Note that a unique directory is created for the binaries. In my case: ~\arduino_build_91191
The full line from my Arduino IDE looked like this:
C:\Users\gojimmypi\AppData\Local\Arduino15\packages\sandeepmistry\tools\openocd\0.10.0-dev.nrf5/bin/openocd.exe -d2 -f interface/cmsis-dap.cfg -c ; -f target/nrf51.cfg -c program {{C:\Users\GOJIMM~1\AppData\Local\Temp\arduino_build_91191/sinobit.ino.hex}} verify reset; shutdown;
In order to launch OpenOCD to simply listen, and not upload - minor modifications are needed. Remove everything after and including the "-c program":
C:\Users\gojimmypi\AppData\Local\Arduino15\packages\sandeepmistry\tools\openocd\0.10.0-dev.nrf5/bin/openocd.exe -d2 -f interface/cmsis-dap.cfg -c ; -f target/nrf51.cfg
Upon launching this in a DOS window, the resulting output looks like this:
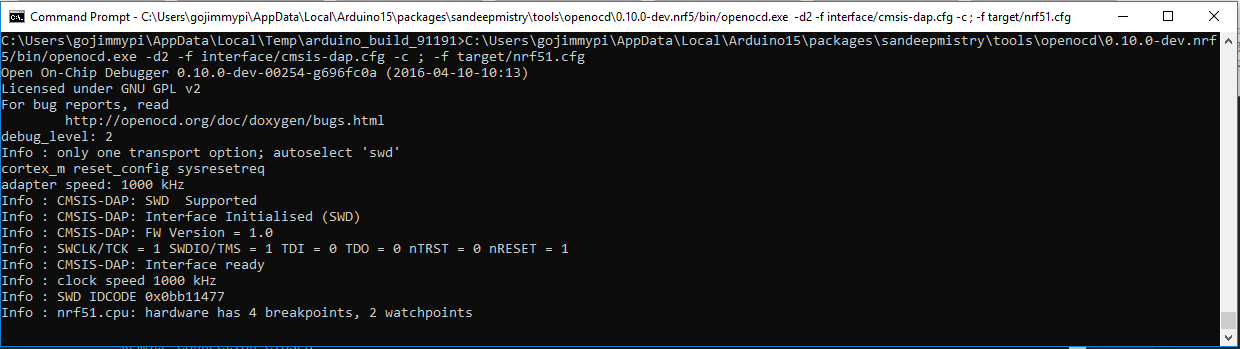
Note that OpenOCD will not exit. It is waiting and listening for a GDB connection.
In my case, I could not find a suitable Windows GDB executable. So I ventured into the land of WSL - specifically Ubuntu. (I also wrote a little blog on OpenOCD on WSL Ubuntu). Once a local Ubuntu is installed an operational, GDB can be added:
sudo apt-get install gdb
cd /mnt/c/Users/gojimmypi/AppData/Local/Temp/arduino_build_91191
GDB is launched like this:
gdb -d ./ -d /mnt/c/Users/gojimmypi/AppData/Local/arduino15/packages/sandeepmistry/hardware/nRF5/0.4.0/cores/nRF5 -f sinobit.ino.elf
If all goes well, when GDB is running and accepting commands, if will look something like this in the WSL Ubuntu window:

Due to the oddities of Windows vs Linux, I first ran these commands:
# C:\ is found in /mnt/c
set substitute-path c:/ /mnt/c

# There was an odd case problem in Arduino15 vs arduino15
set substitute-path /mnt/c/Users/gojimmypi/AppData/Local/Arduino15/ /mnt/c/Users/gojimmypi/AppData/Local/arduino15/

# make really sure the current directory is used
directory ./
Then connect:
target remote localhost:3333
monitor reset init
The resulting GDB window in Ubuntu should look something like this:

The OpenOCD DOS window should have updated, and look something like this, showing the successful connection:

At this point, things are really exciting! Ready to debug? Sadly, no. Typing the GDB "step" command results in the dreaded message:
Cannot find bounds of current functionI also tried to use the VisualMicro add-in for Visual Studio, no joy there, either:
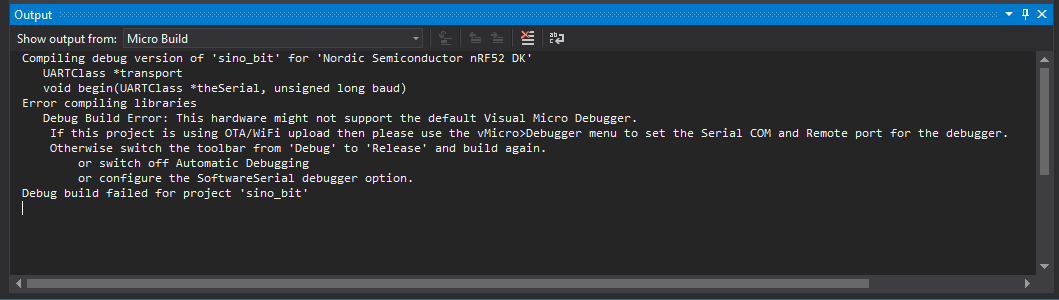
Although it certainly works to compile and upload code in "release" (no single-step debugging) mode:

@TheFlyingSephyr also suggested trying the Embedded Studio IDE with the Segger hardware debugger. Perhaps another blog for another day...
On a side note, it might me interesting to peek at the elf file:
sudo apt-get install binutils
readelf -a /mnt/c/Users/gojimmypi/AppData/Local/Temp/arduino_build_91191/sinobit.ino.elf
In the end, it seems that you simply can't get to there from here when attempting to debug a "soft device". :| If you have any ideas, please leave a comment or send me a message at gmail.
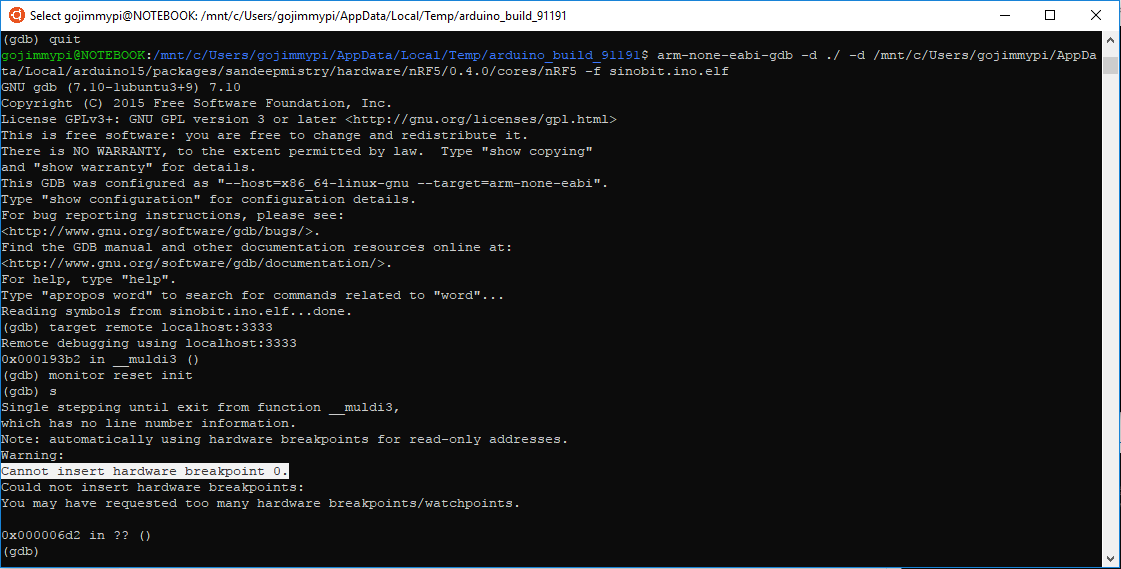
UPDATE: I've had a few replies regarding other debugging options. In particular a tweet from Tomas indicating that perhaps Mbed tools might help. Indeed there's some interesting info that shows using arm-none-eabi-gdb and pyOCD. Although I was able to get that toolchain installed and working:

I was not able to actually get single-step debugging working (nor does the Mbed instruction page indicate this is even possible). Note the error:
(gdb) step
Warning:
Cannot insert hardware breakpoint 0.
Could not insert hardware breakpoints:
You may have requested too many hardware breakpoints/watchpoints.
As show here:
Another more promising method (although considerably more complex and potentially expensive) - would be the hardware debugging method using JTAG. One of the key things needed here is of course is how to connect the debugger. Many thanks to Elecrow for the prompt reply on twitter for information on the Sino:bit JTAG pins:

What you cannot immediately see from the silkscreen is that those are pads and not through-holes. Another item on my wish list for version 2! (ok, let's make the proper wish: how about a actual header for JTAG connector!)
I'll create another blog page for the Sino:bit JTAG. My first attempt will be using my $2 Blue Pill STM32F103 board converted to a Black Magic Probe.
Overall the Sino:bit seems very cool, despite the problems with OpenOCD and GDB. It would be awesome if some sort of single-step debugging was possible - bit that certainly is not a showstopper. Most people, certainly not beginners - would never even attempt this type of debugging. Other changes I would make would be having a less intensely bright power LED, and making the 12 x 12 grid of LED's multi-color.
Resources, Inspiration, Credits, and Other Links:
- github - sinobit hardware
- StackExchange - How do I debug a Arduino Uno with gdb on a Linux pc?
- https://github.com/sandeepmistry/arduino-nRF5#selecting-a-softdevice
- Bash for Windows colors are unreadable with default terminal theme #7556
- GDB - Specifying Source Directories
- GDB - Setting Breakpoints
- stackoverflow.com: Why I do get “Cannot find bound of current function” when I overwrite the ret address of a vulnerable program?
- Nordic Developer Zone: debugging softdevice applications with gdb
- going beyond the arduino ide
- forum.arduino,cc - How do I use a Makefile?
- Compiling Arduino sketches using Makefile
- github sudar/Arduino-Makefile
- arm MBED CMSIS DAP
- Nordic Semiconductor adds Embedded Studio IDE support for nRF51 and nRF52 SoC development


No comments:
Post a Comment
comments are disabled as nobody seemed to understand the no spam request.
See my latest blog at gojimmypi.github.io
Note: Only a member of this blog may post a comment.